
TEDx Talk
Our stories, visualized
🎐 Instagram: instagram.com/federicafragapane
🔖 Twitter: twitter.com/fedfragapane
In May 2019 I had the honor to give a TEDx talk at TEDx Verona and I visualized some audience's data.
Talk link: https://www.youtube.com/watch?v=_RvGJFMK_sg.
During the speech I talked about my experience as Information Designer and about a personal event that had a certain impact on my life and also on my career. I've also wrote about it here: I’m a Visual Designer whose sight is not perfect anymore.
My TEDx talk

Talking at TEDx Verona
I've then shared the process and the reasons behind one of the personal projects I'm most fond of, The Stories Behind a Line. The project shows the complex and painful experiences lived by six asylum seekers arrived in Italy in 2016.
Everyone has is own line and is own story and before the talk I've asked the audience a few data about 3 significant places in their lives + a city they'd like to visit, so as to draw a small fragment of their lines. I then visualized such lines.
These elements are significant to me because they give voice to people. And I really would like to keep on working on this aspect.
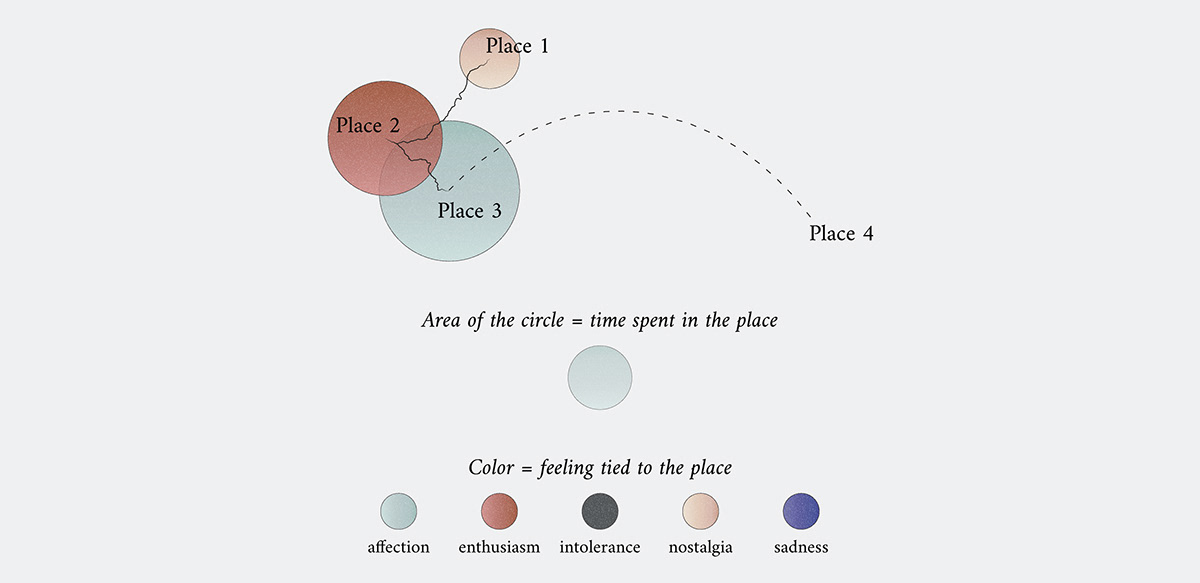
TEDx Talk – Visualizing Stories: how to read it
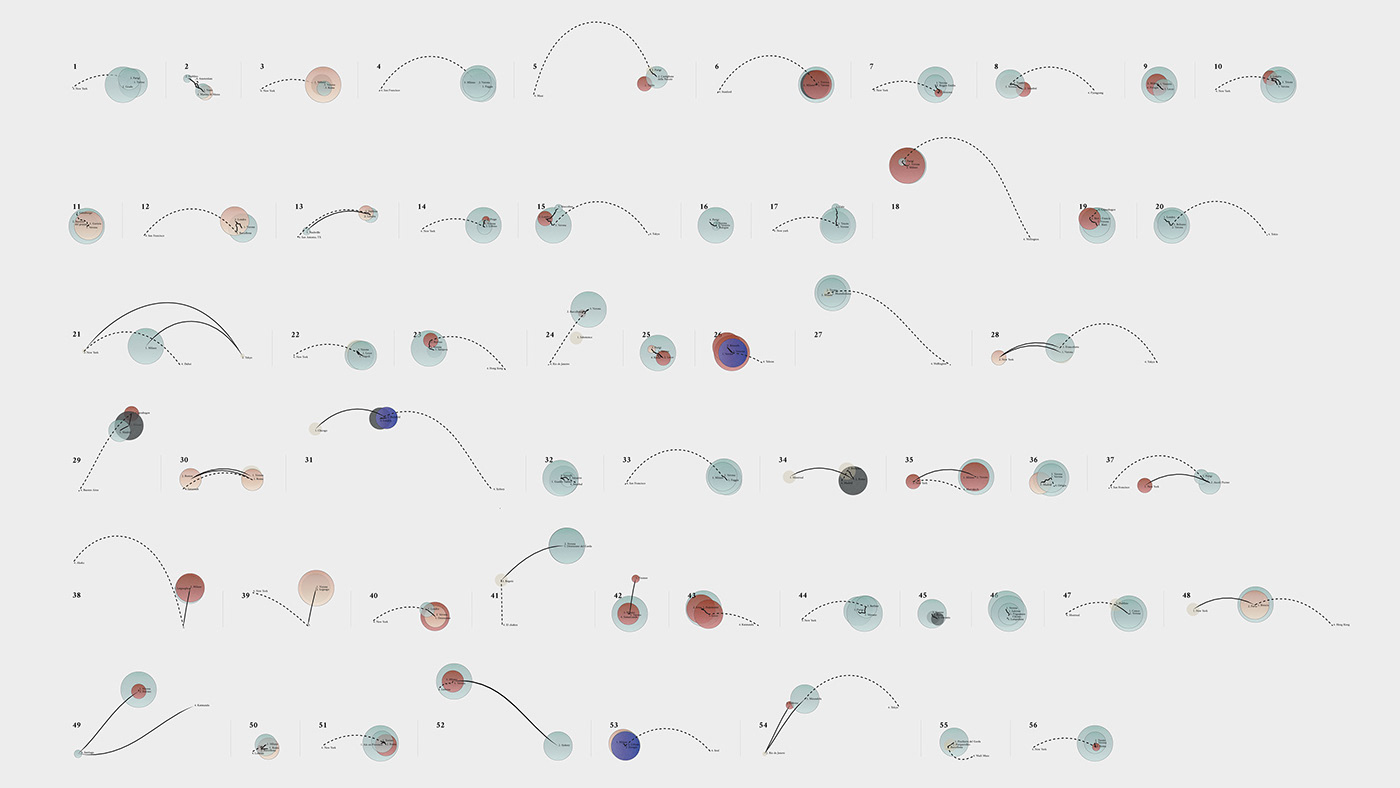
The personal lines, visualized
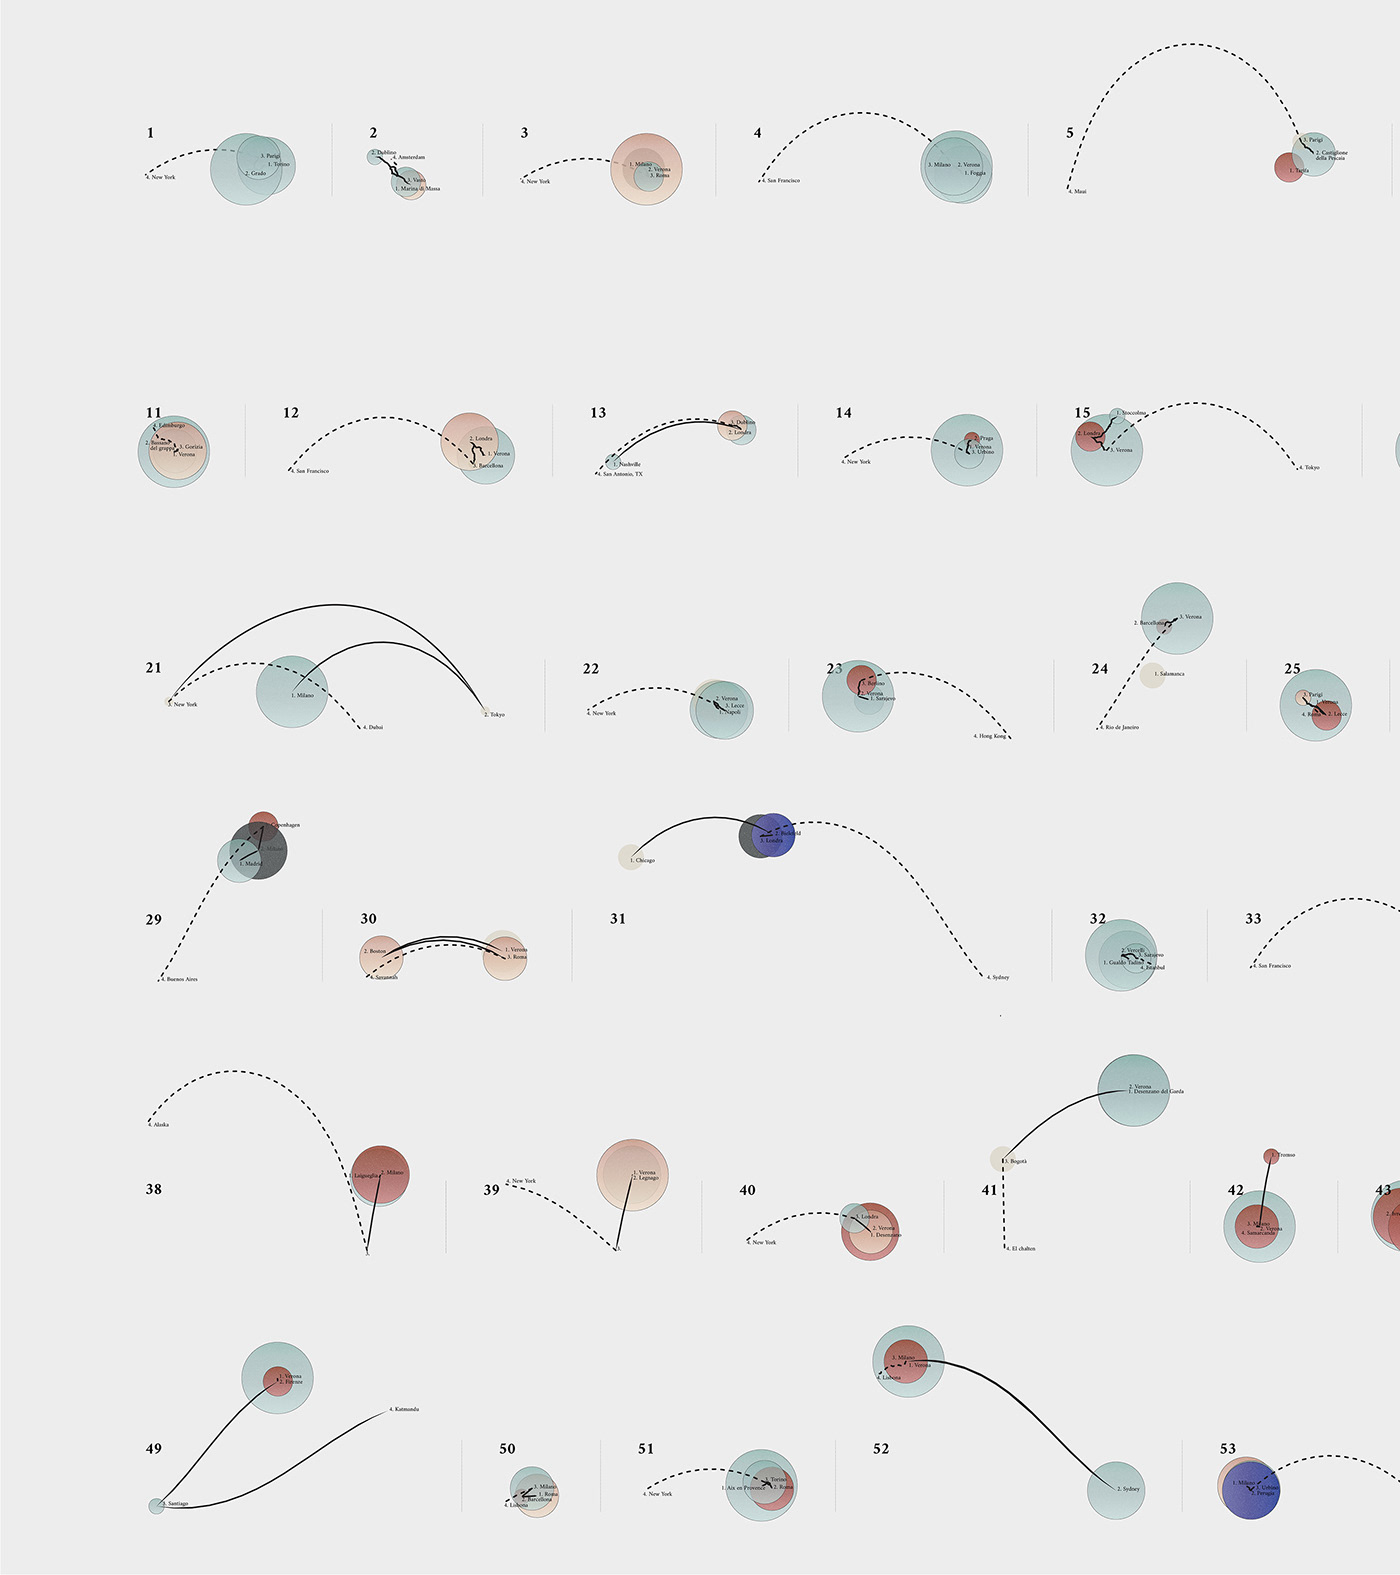
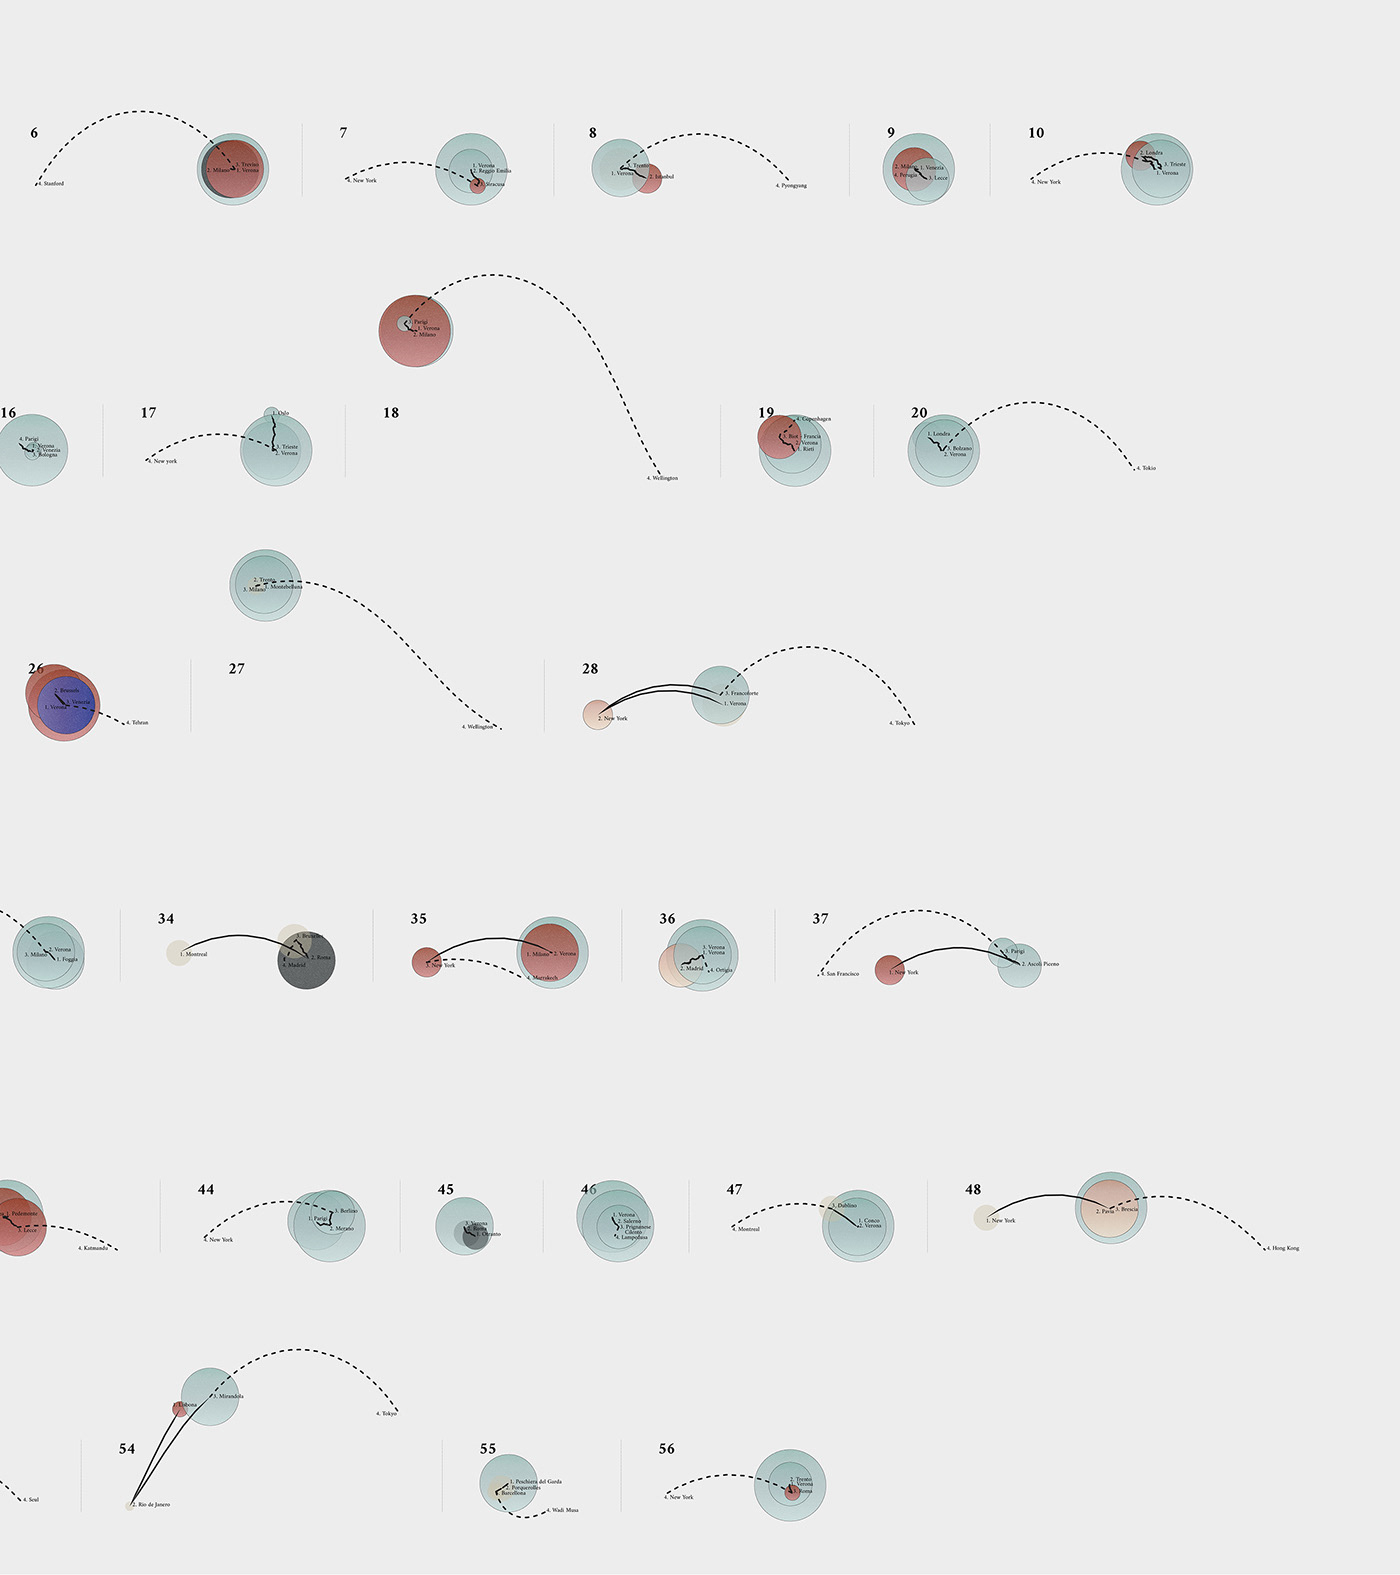
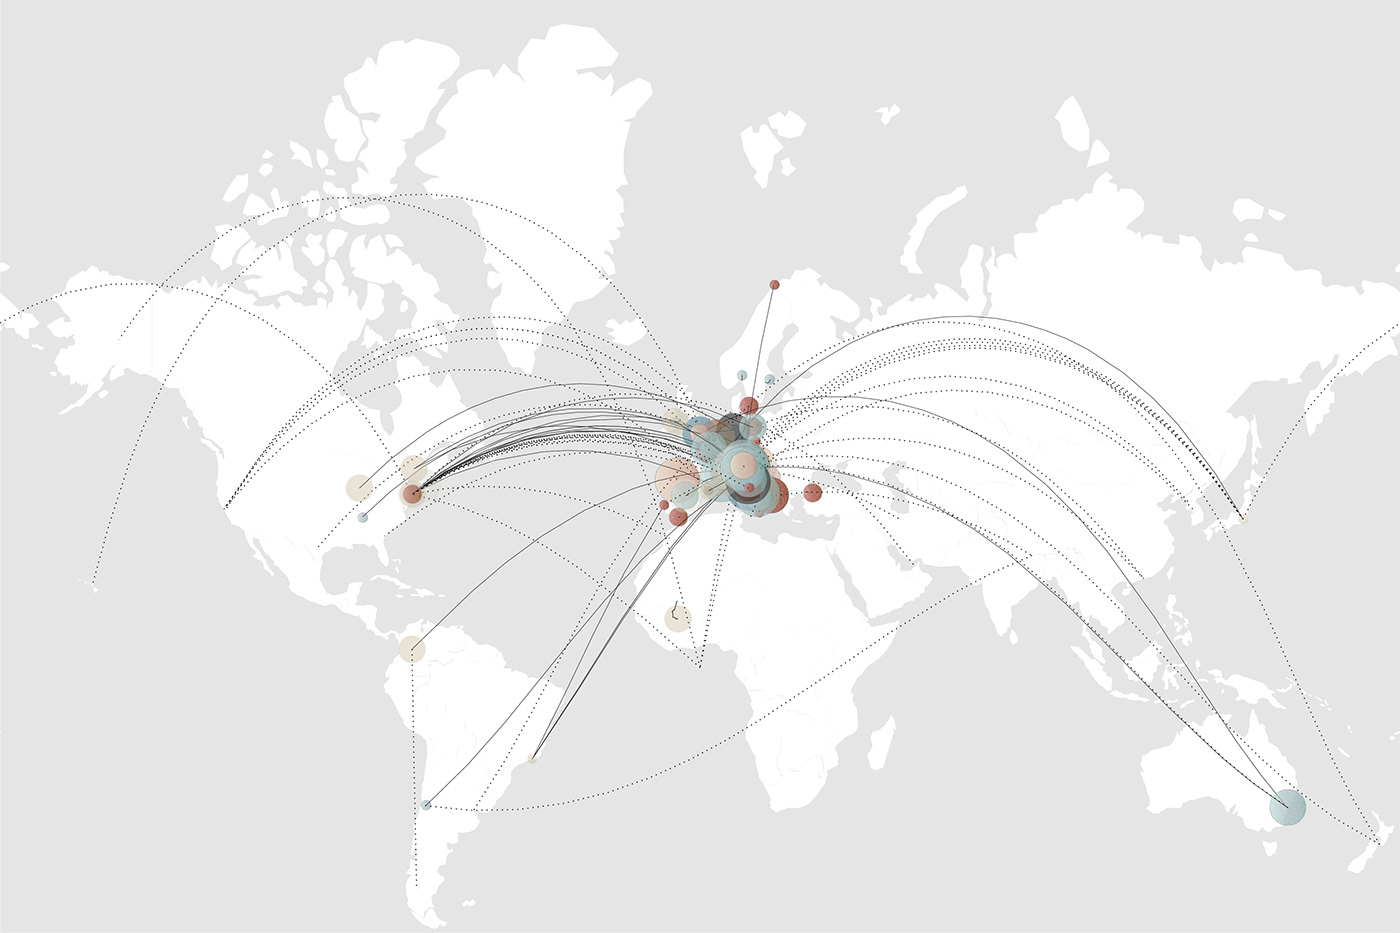
The map behind the lines. The dotted ones go to the places people would like to visit
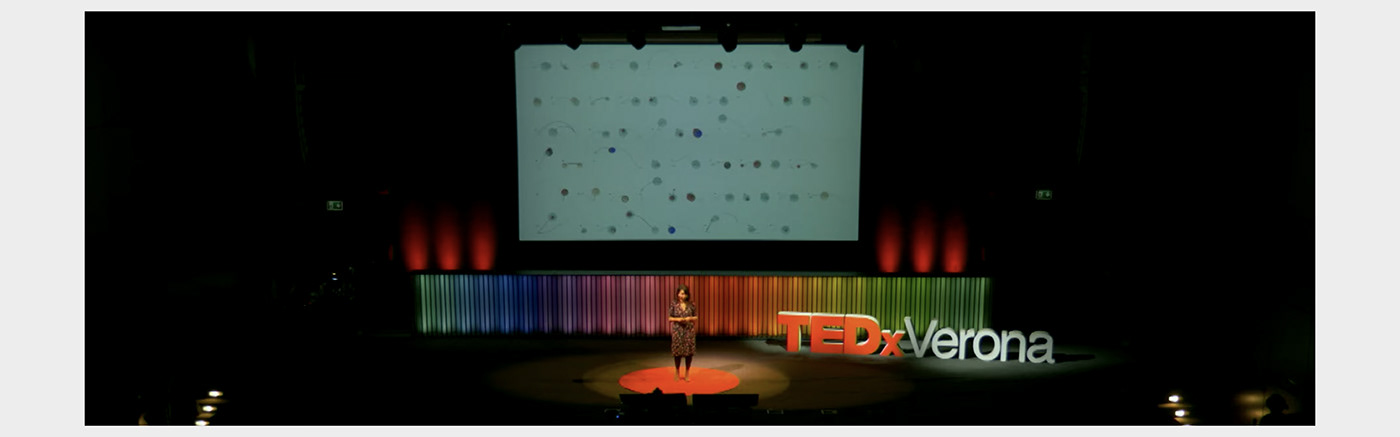
The lines on TEDx Verona's stage
You can watch the complete talk here!
🎐 Instagram: instagram.com/federicafragapane
🔖 Twitter: twitter.com/fedfragapane


