


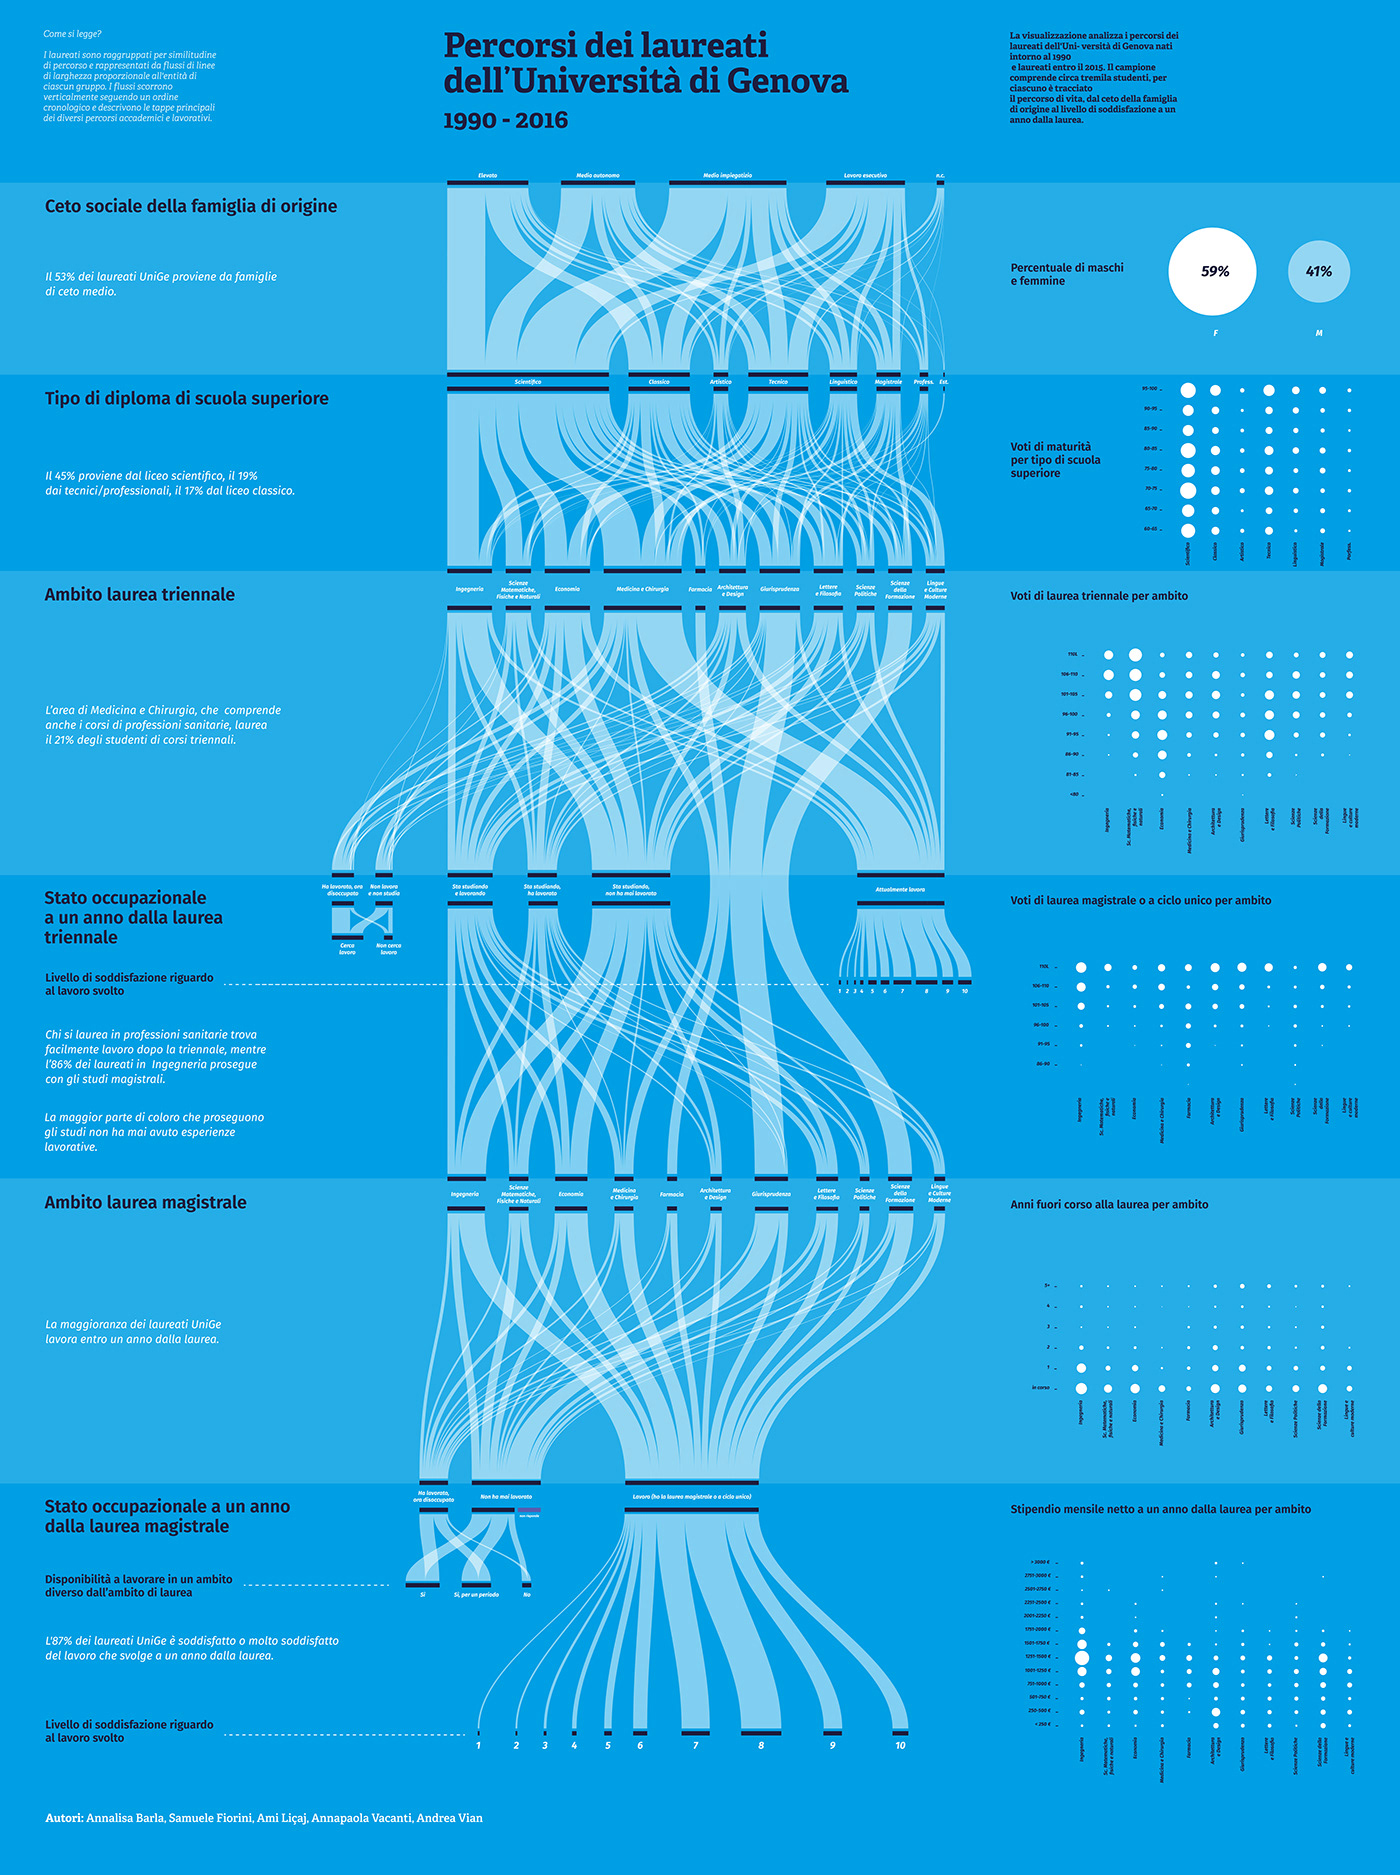
The visualization analyzes the paths of graduates
of the University of Genoa born around 1990 and graduated by 2015.
The sample includes about three thousand students,
for each one the life path is traced,
from the social class of the family to the level of satisfaction
a year after graduation.
How to read it?
Graduates are grouped by path similitude and represented
by flows of lines proportional to the size of each group.
The stream flow vertically following a chronological order
and describe the main stages of the different academic and work paths.
Team: Annalisa Barla, Samuele Fiorini, Ami Liçaj, Annapaola Vacanti, Andrea Vian.