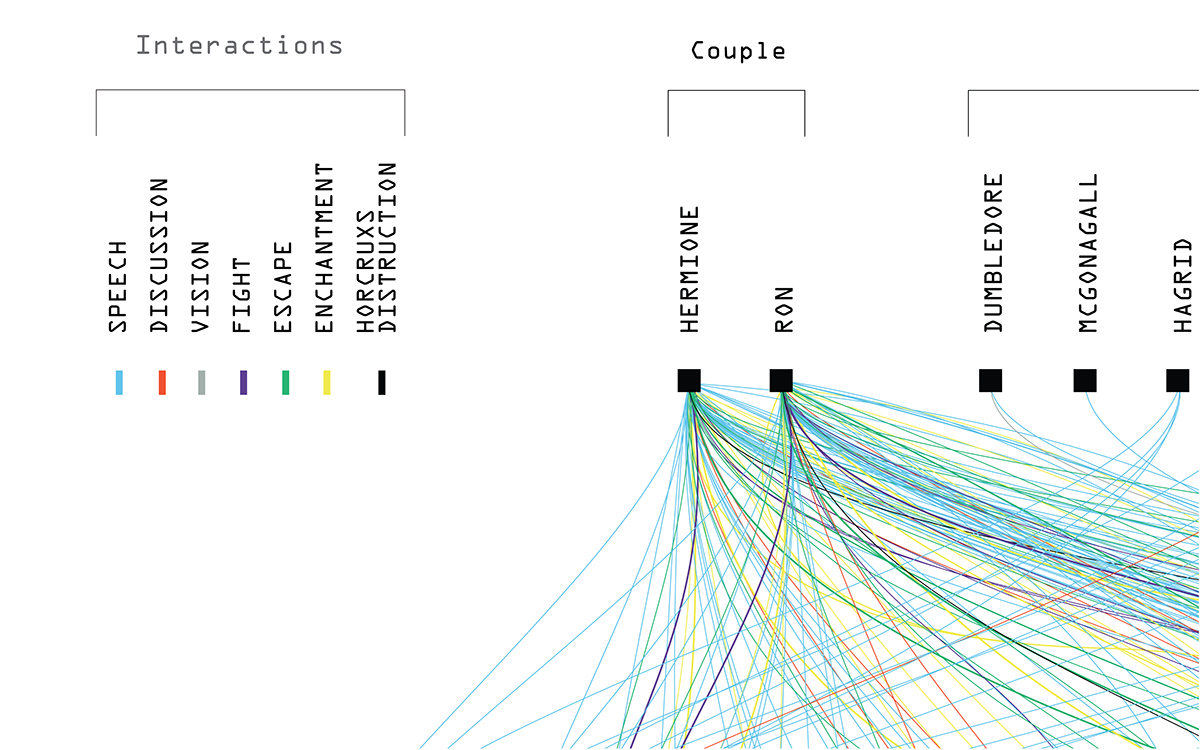
Our porpouse was to show the different type of interactions that Harry Potter has in the seventh and last movie of the saga. For doing that, at first we created a table in which we marked every different interaction, the characters with which this happens, the specific second and the place where this happens.
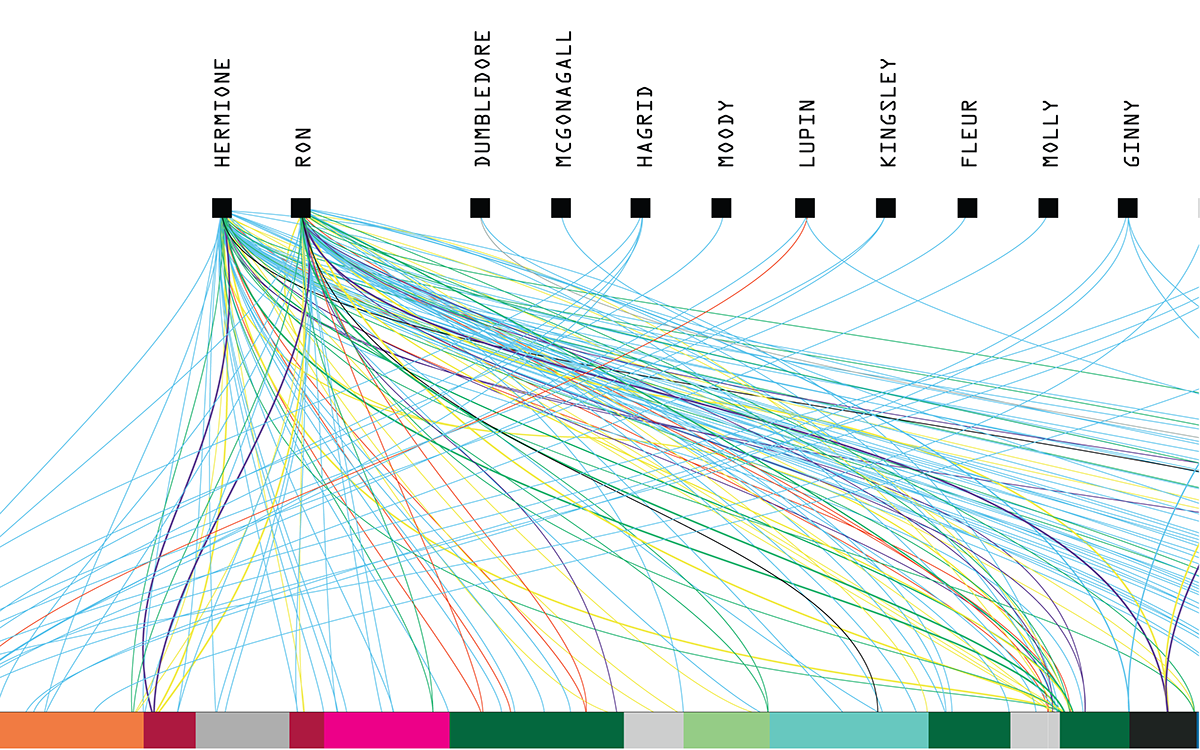
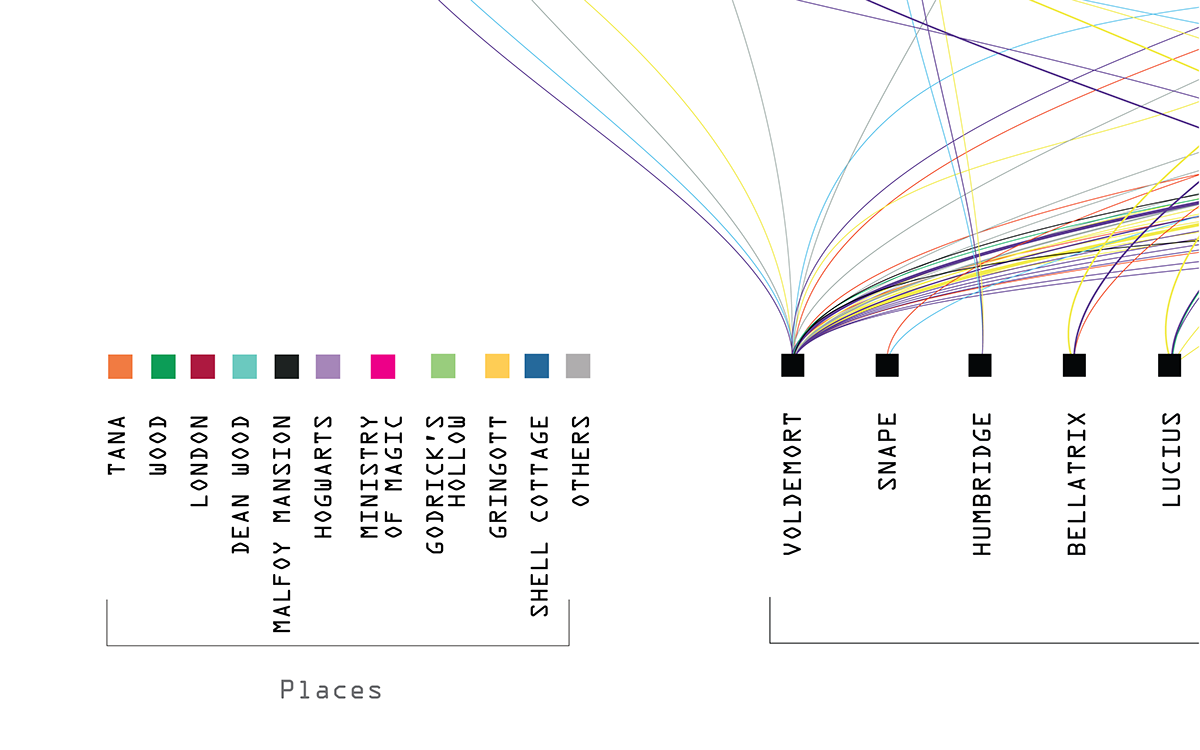
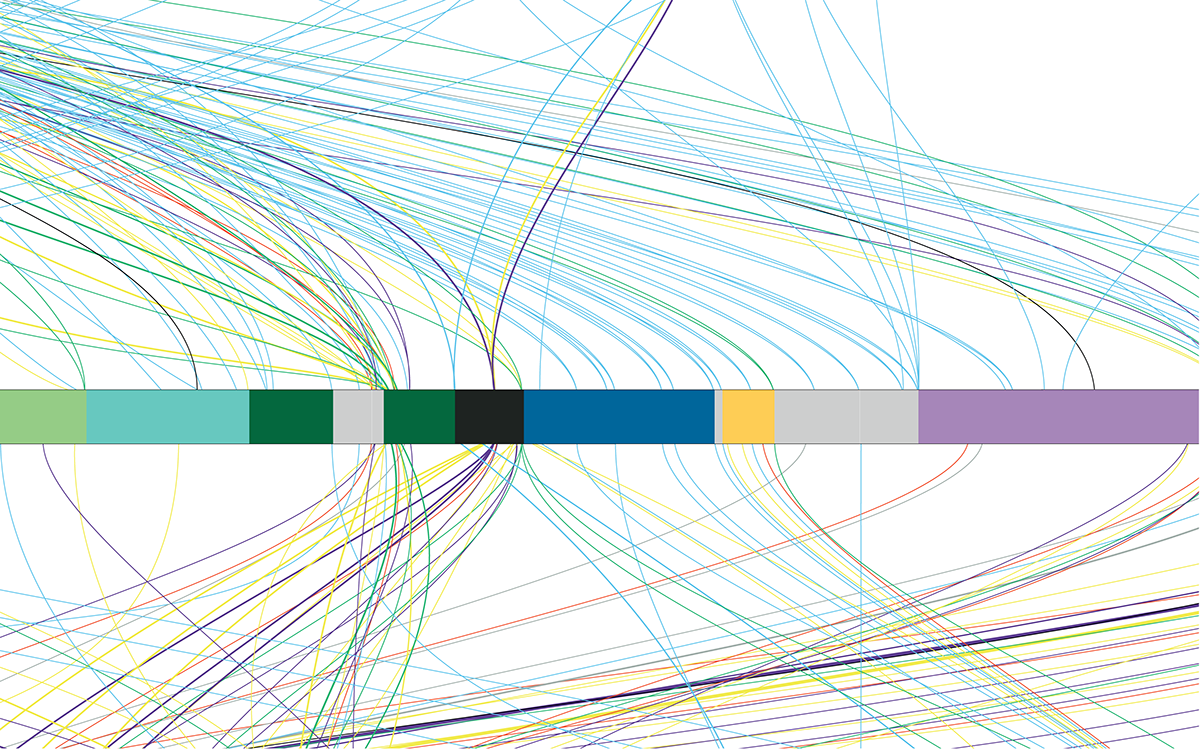
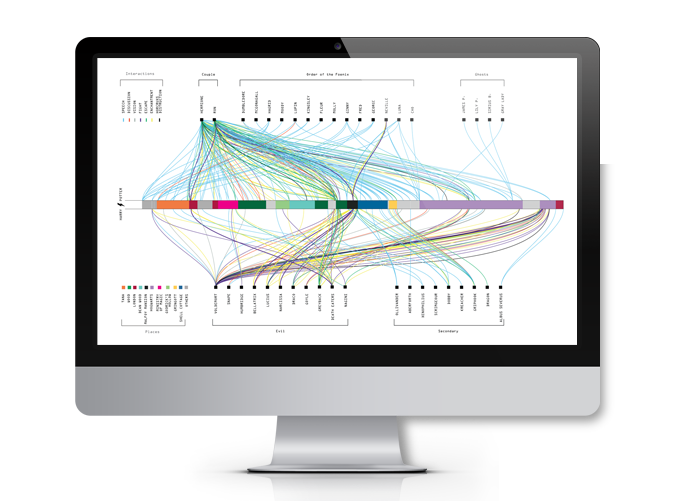
In the Part 1 of the project we decided to combine theese data in this way: Harry is represented by an horizontal line that is divided by places and by seconds (1 px is 11 sec); from this centerline start many other lines, which are connected with the names of the characters (divided into 5 groups) who interact with Harry.
Lines are colored differently depending on the kind of interaction (speech, discussion, fight, escape, enchantment and Horcruxs Disctruction).
http://www.visualizing.org/visualizations/harrys-interactions-harry-potter-and-deathly-hallows-part-1

The Part 2 shows in the same way the different kinds of interaction between Harry and the characters, with the difference that the user can interact with the infographic choosing what to display, whether to show only specific characters or some specific interactions of their choice, or see the full map as the first part.
http://www.visualizing.org/visualizations/harrys-interactions-harry-potter-and-deathly-hallows-0
In the Part 3 of the project we decided to show all the interactions between Harry and the other characters in a video to emphasize the flow of time and the consequentialism of the actions.
Harry is located at the top on the right with all the list of characters below him. Every interaction has their own color (like the legend on the first part) and is represented by a rectangle which flow on the left and start from the square of the specific character who do the action. When one or more characters are doing an interaction, their square change from gray to black to highlight their presence in a particular moment. The enchantments are represented by many little yellow rhombs which appears on the timeline.
Harry is located at the top on the right with all the list of characters below him. Every interaction has their own color (like the legend on the first part) and is represented by a rectangle which flow on the left and start from the square of the specific character who do the action. When one or more characters are doing an interaction, their square change from gray to black to highlight their presence in a particular moment. The enchantments are represented by many little yellow rhombs which appears on the timeline.
http://www.visualizing.org/visualizations/harrys-interactions-harry-potter-and-deathly-hallows-part-3