

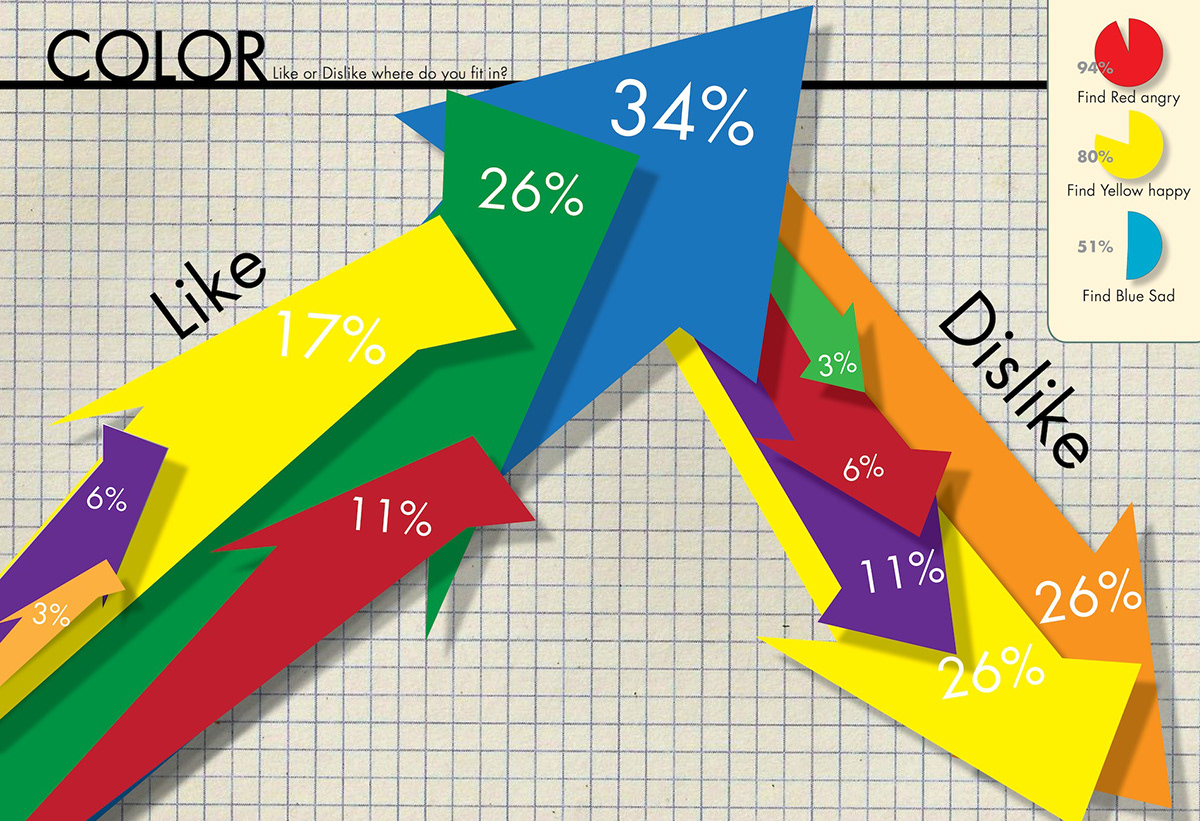
Interpreting data sets graphically

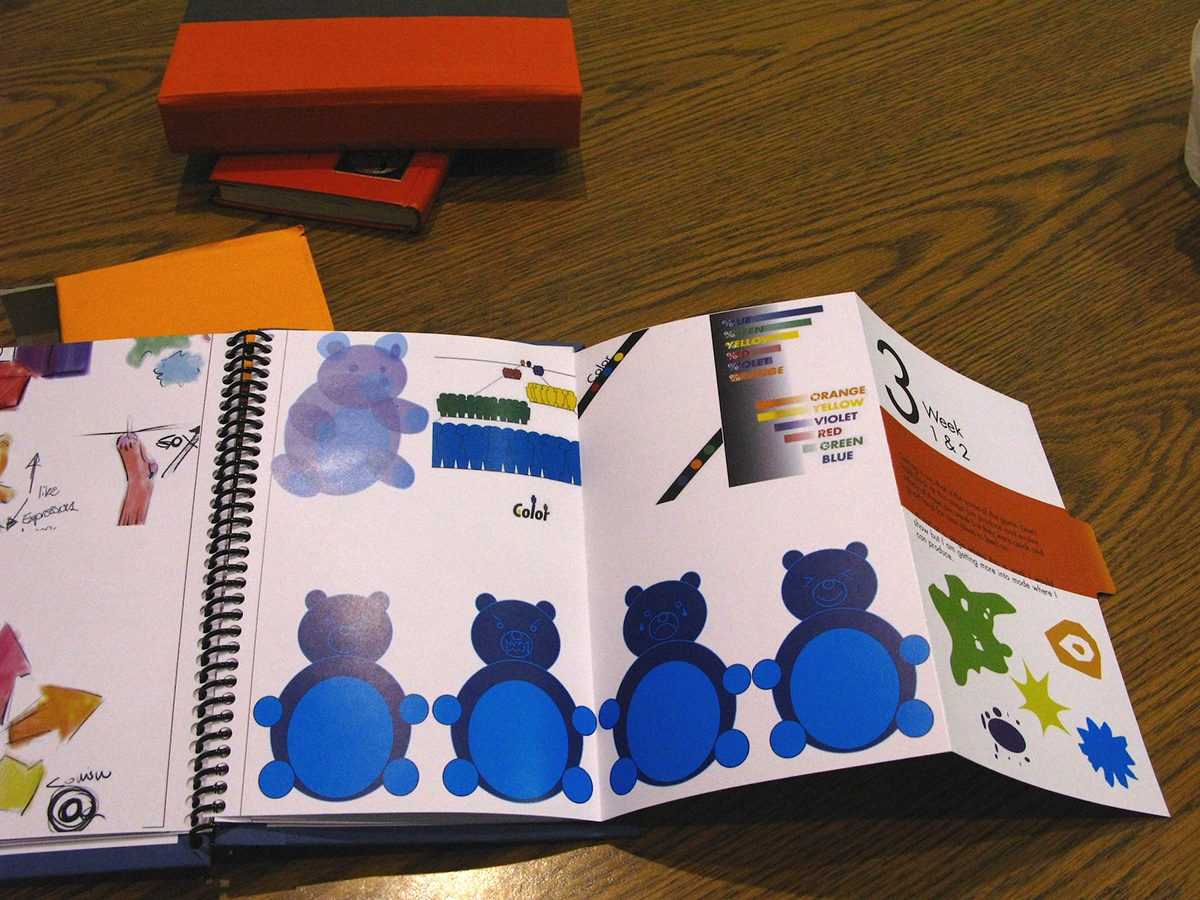
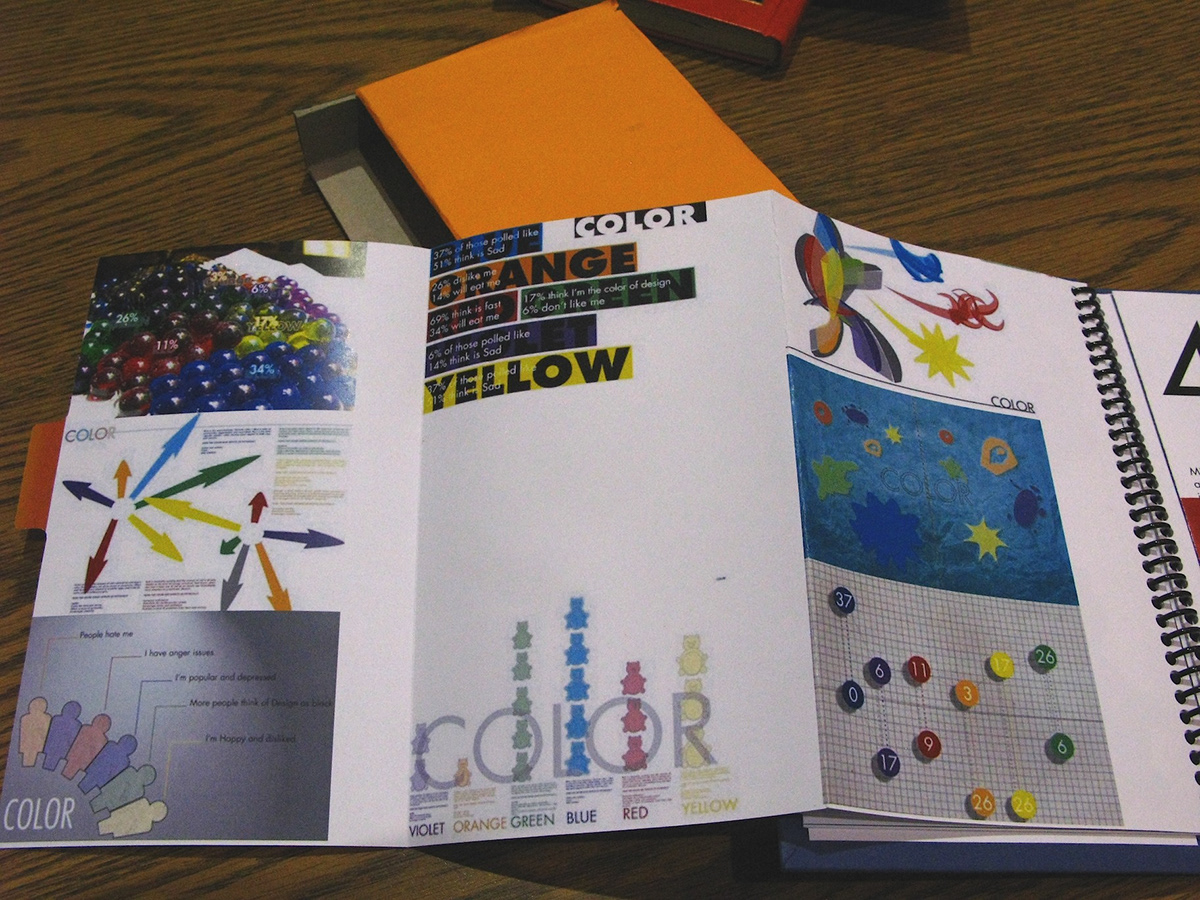
I wanted to create a different process book form the first one and I was also looking at ways to conserve on paper use. So I worked out a pullout design that tripled my page count for the same amount of pages printed. Although I'm not so keen on the binding I like the finished results.