Data Visualization workshops
As Information Designer, I love to share my competencies and the lessons learnt during the years through workshops and trainings.
I usually work with the participants on the creation of effective and meaningful visual narratives, giving them the possibility to explore all the phases that characterize the act of designing a data visualization: selection of the topic and the dataset, data analysis, visual inspiration and definition of a specific visual model, test of the piece's effectiveness and refinement phase.
It's really important for me to give the participants the possibility to start from their personal interests and inclinations. For this reason the training usually guides them in selecting the data and the story that they’re interested in communicating.
New scheduled workshop!
Finding Elegance: Designing With Data – 21 & 22 April 2020, Amsterdam


The datasets: examples from previous workshops
After the data analysis phase, in order to define the proper visual model to visualize them, an important phase for me is the inspiration one. During the years I’ve noticed that for me defining the structure of a data visualization is a step that has two kind of influences.
The main one is given by the data themselves. I study them, filtering and ordering them, to see what could be the best way to show them. And then there is another kind of influence, a subtler one, that is caused by the inspiration phase. The shapes and the visual elements I’ve filled my eyes with in the inspiration phase help me in defining new visual structures.
During my trainings I work with the participants on both such phases, in order to create with them meaningful visual narratives and new visual alphabet, made by shapes and colors.
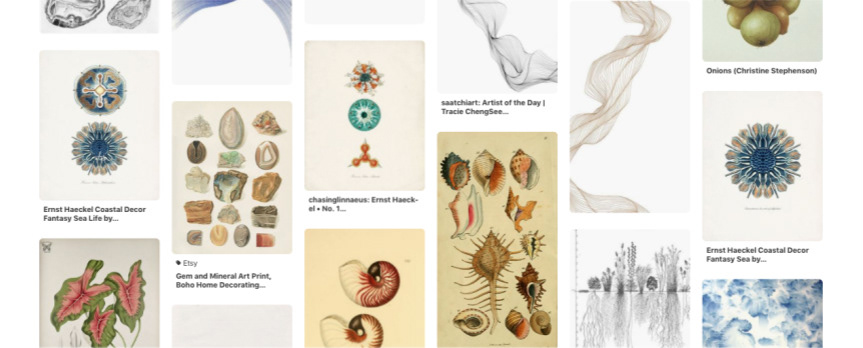
The importance of visual inspiration. Source: Pinterest
For the actual design phase, I have two alternatives: according to the characteristics of the training and the audience, the participants can both drawing their visualizations by hand or digitally design them.
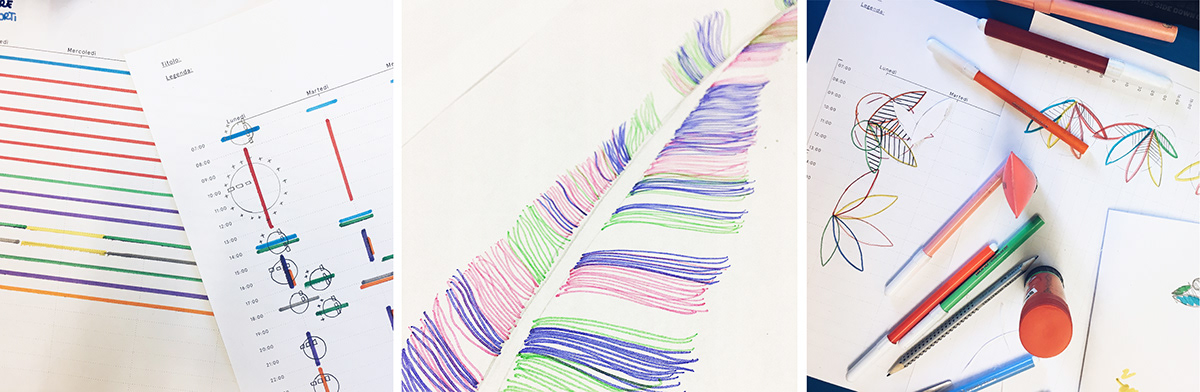
Participants' hand-drawn visualizations

Participants' visualizations designed with Adobe Illustrator
And then there is the testing and visual refinement phase. Participants are usually invited to test their visualizations, showing them among each other and then to re-look at them with a new and fresh point of view. This refinement phase can help them in finding those elements and details that can have a significant role in the creation of an effective and elegant visual narrative.
The data sculpture approach
In some of my workshops, before the main activity I also work with the participants on designing custom data sculptures, starting from simple datasets and using white modeling clay.
Purpose of the activity is to give a physical shape to numerical data: trough this step participants can experiment with shapes and 3D visual models, so as to be ready to come back to the 2D data visualization phase with fresh and new points of view and ideas.
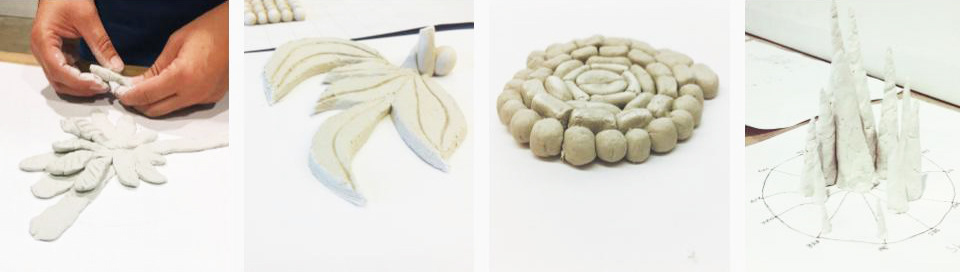
Experimenting with data sculpture
Past selected workshops
Finding Elegance: Designing With Data – Graphic Hunters, Utrecht
Our Future, Visualized With Data – Vanity Fair, Milan
From Data to Stories – Domus Academy, Milan
Designing Visual Data Narratives – Visual Journalism School / Free University of Bozen - Bolzano, Bozen
Design Re — Actions – Università degli Studi di San Marino, San Marino

