
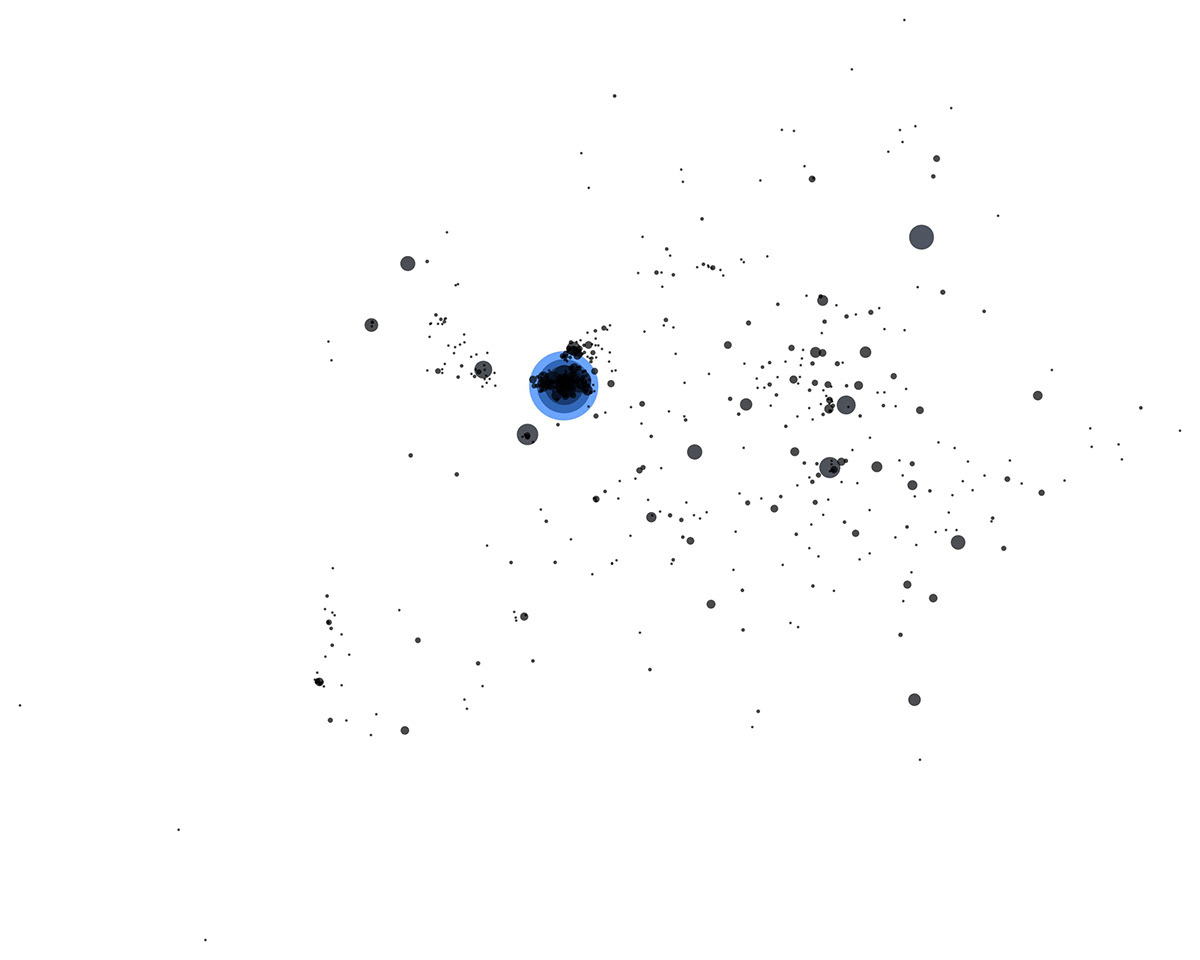

Visualization that show the number of visitors for a particular website. The first is a map of the world, the second a map of Europe and the third a map of Belgium. Data was acquired from the Google Analytics API and the images were built using Processing.


