Kimola Dashboard
Kimola Analytics is a data analytics service that unveils various aspects of consumers' lifestyles, collects customer feedback and provides SaaS products for professional researchers. Kimola's proprietary artificial intelligence engine forms the basis for any consumer research by accurately selecting the right quantity and quality of social media users.
It assists in creating in-depth research reports from the open data of these users. The platform allows real-time observations of the habits, interactions with brands, preferred news sources, locations spent, and interests of target audiences, segmented by demographics such as age, gender, and socio-economic class.


What did we do?
After jointly conducting the website design process introducing Kimola's social media data analytics services, we moved on to the second phase of the project. We prepared dashboard designs that will show the flow of all this data that will be presented to the user who purchases the product, visual elements specific to the designs, and interface designs with a global approach in line with the brand identity.
These studies, which we prepared in 2018, continue to be used by the Kimola team.
These studies, which we prepared in 2018, continue to be used by the Kimola team.

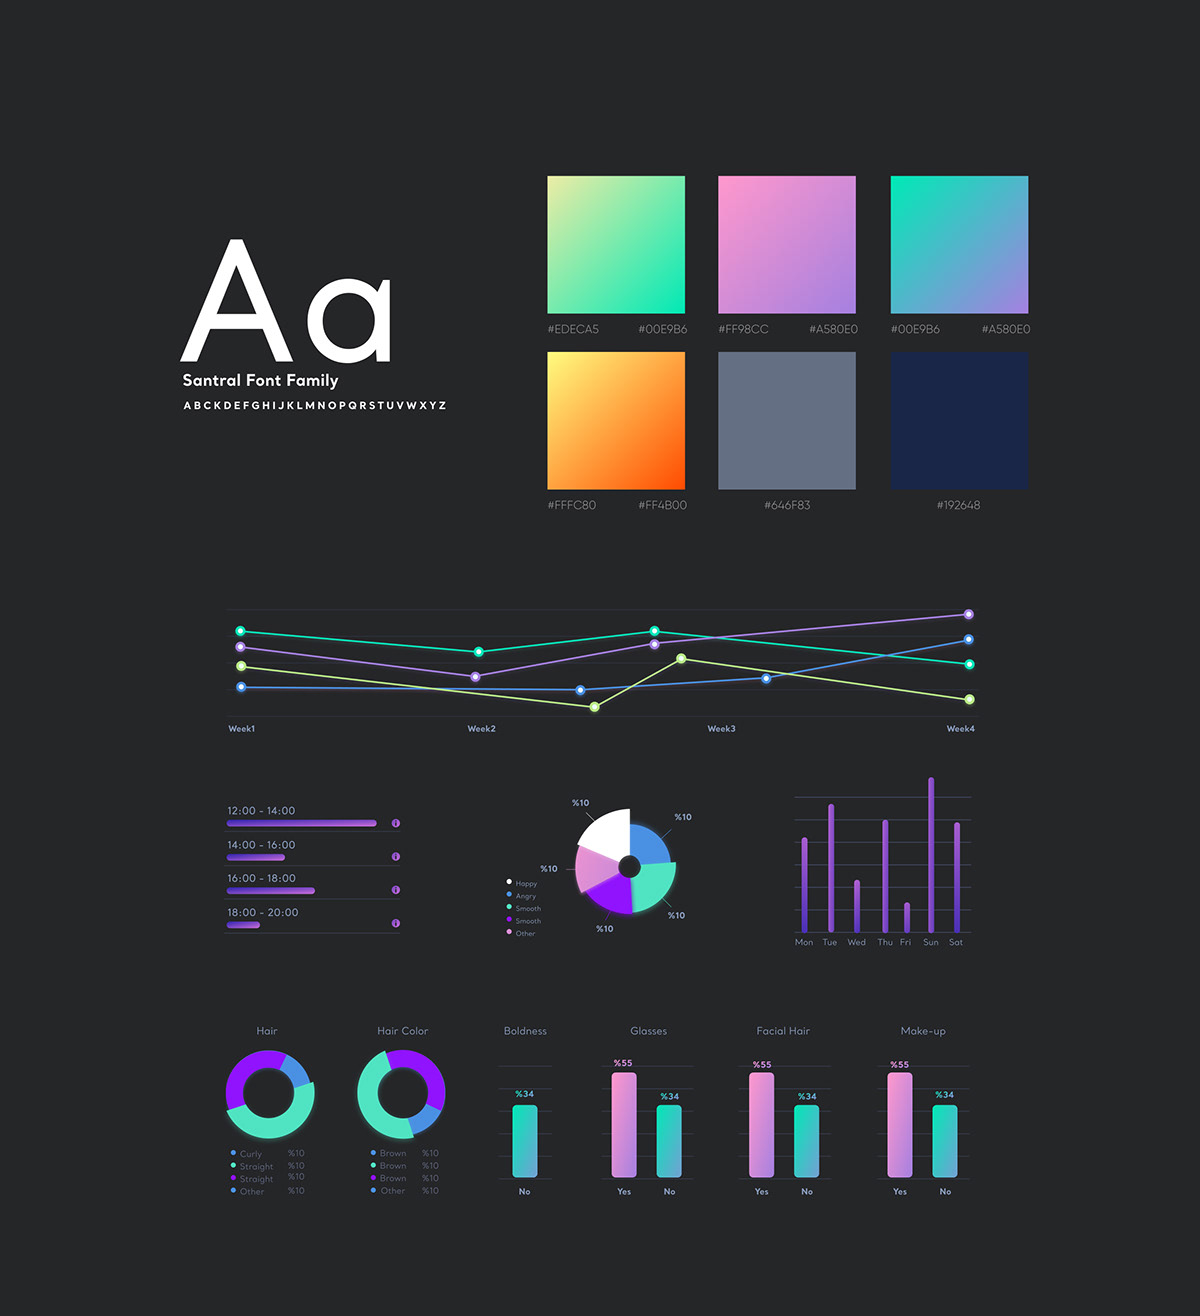

Transferring data to graphics
The presentation of data through graphics required diverse disciplines due to the varying nature of the data variables.
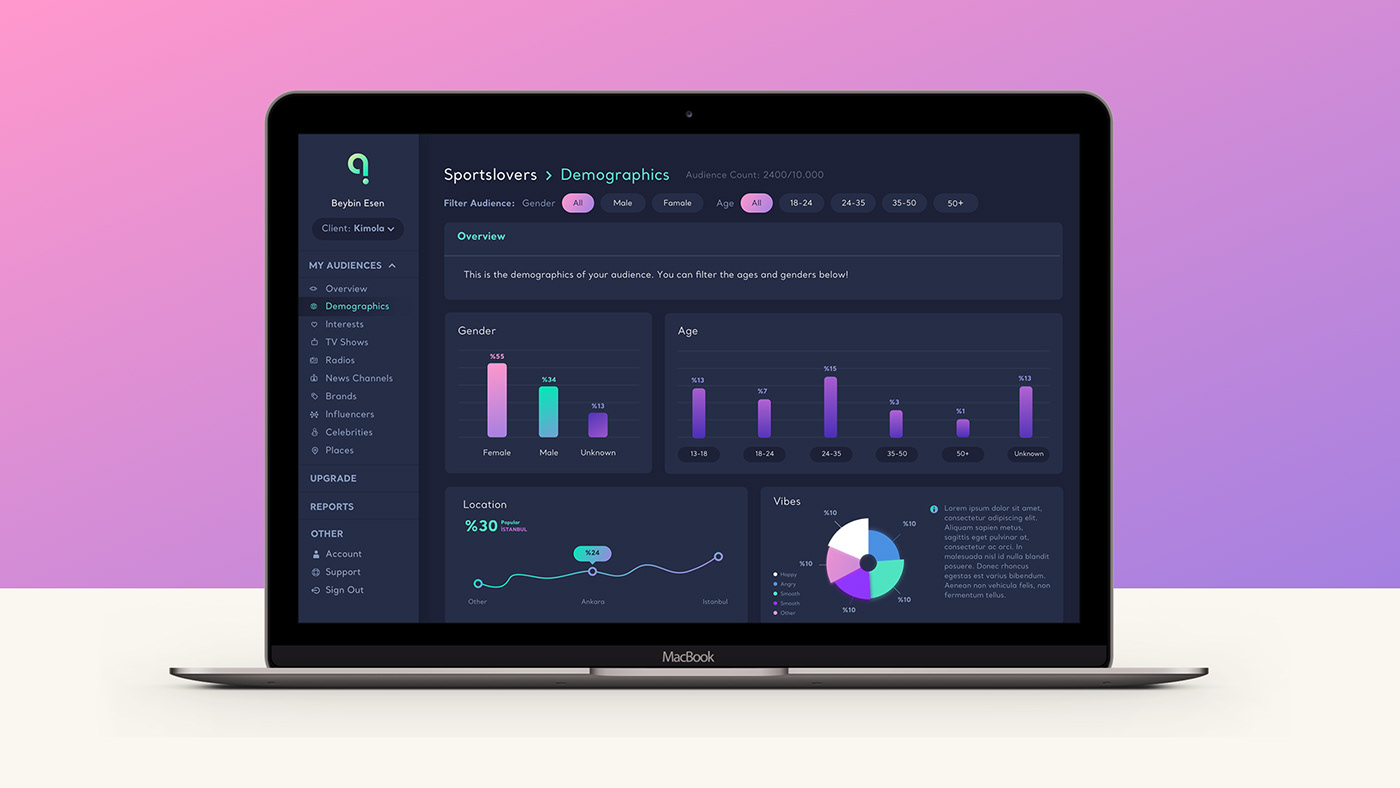
The dashboard designs encompassed a wide range of data. We needed different types of graphics to visually convey these data in the best possible way. Another crucial aspect was the necessity for the screens presenting this data to be as readable and eye-friendly as possible.
While displaying multiple results in a flow, we also needed to maintain a structured layout. At this point, we decided to establish a dark-themed design discipline for dashboard designs through mutual discussions with the Kimola team.
While displaying multiple results in a flow, we also needed to maintain a structured layout. At this point, we decided to establish a dark-themed design discipline for dashboard designs through mutual discussions with the Kimola team.


Custom icon set
We designed a custom icon set based on the content of messages sent to users.


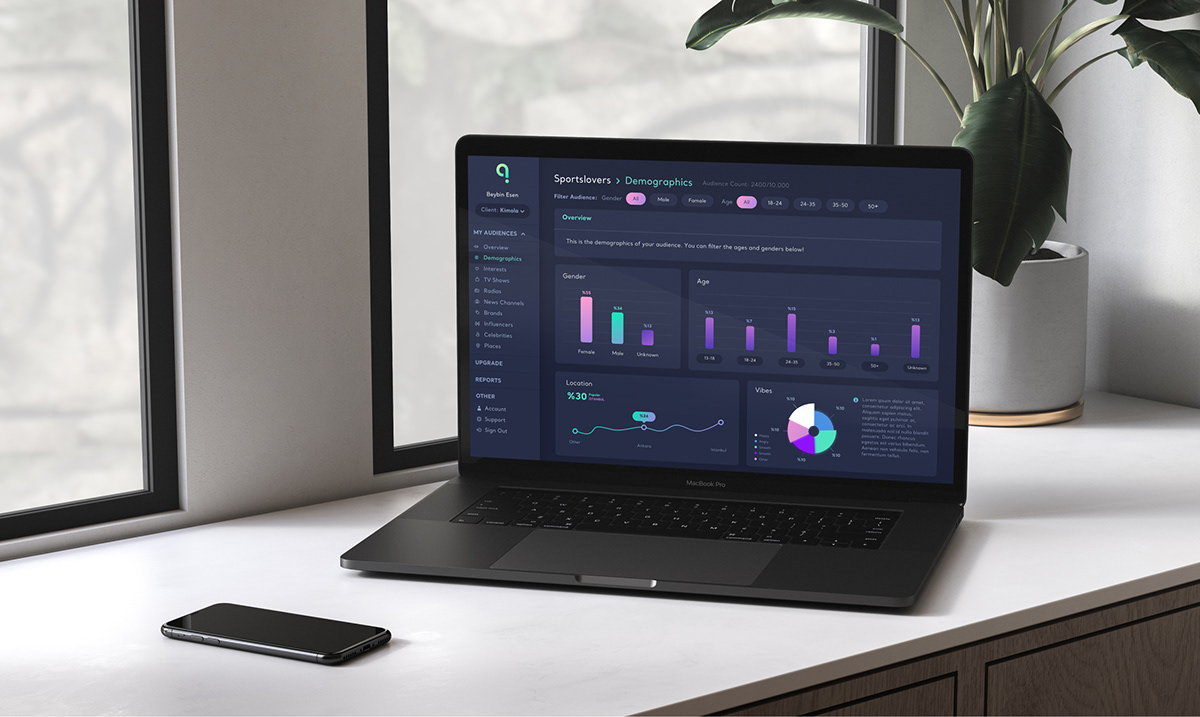
Final
The readability and eye-friendly page layout were prioritized in the designs. While preserving the vivid colors from the corporate identity we created for Kimola, we worked on various graphics in different disciplines according to the data.
In the layout of these graphics on the page, we emphasized the priority of the data. We ensured that all results displayed on the dark background were legible and non-fatiguing for the user. In the end, the dashboards we designed for Kimola Analytics received positive feedback from users.


