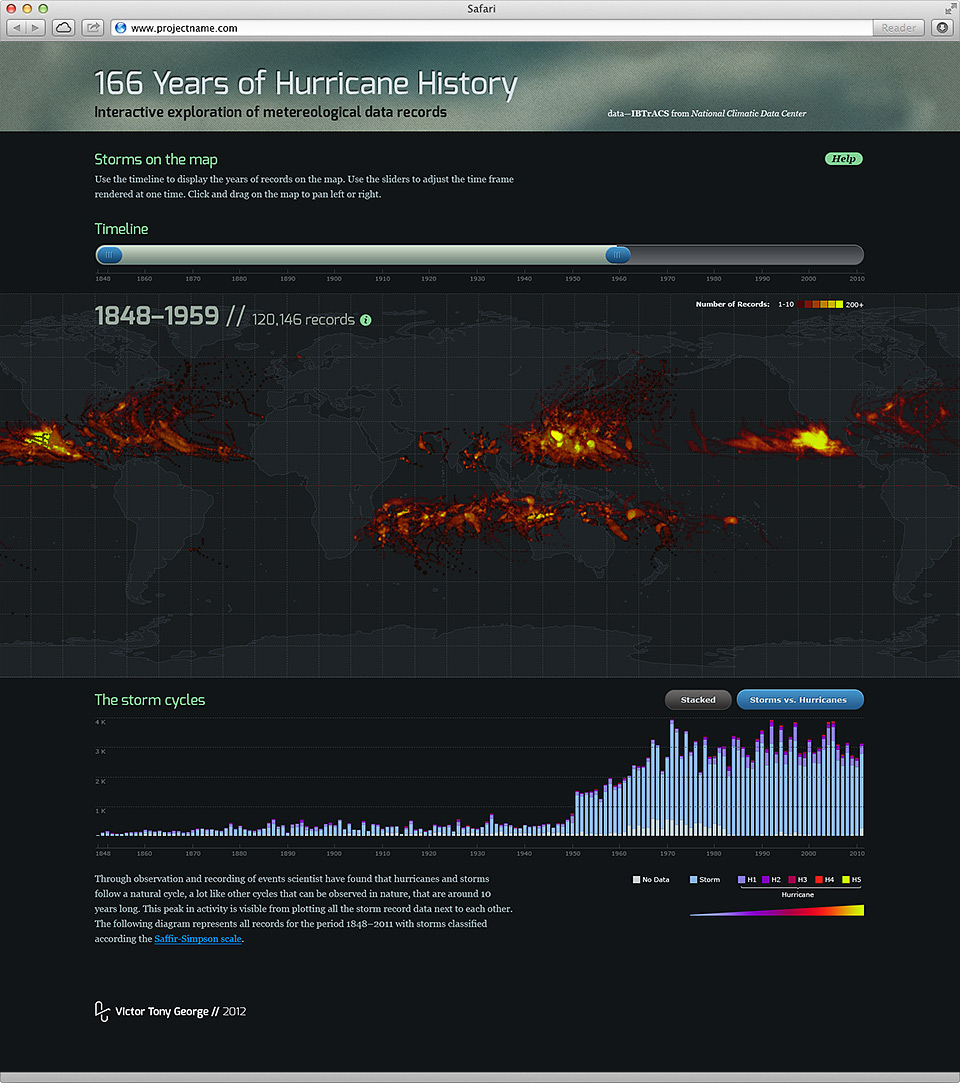
I present to you my Hurricane History Data Visualisation.
This is my final design for my Interactive Data Visualization class @ AAU. This was an interesting project to do as I had to do a lot of research to get the complete dataset, analyze it and come up with a way to visualize it.
I decided to use 2 general visualizations:
* Number of records on particular location (longitude and latitude) as a heat map, plotted on an equirectangular world map projection.
* Stacked bar chart with 2 modes accounting the power of the storm event
* Number of records on particular location (longitude and latitude) as a heat map, plotted on an equirectangular world map projection.
* Stacked bar chart with 2 modes accounting the power of the storm event

All elements grouped together as an interactive map. If I have the time I would revisit my design and develop the interactivity, as it will be definitely interesting to view how human kind is recording those events.

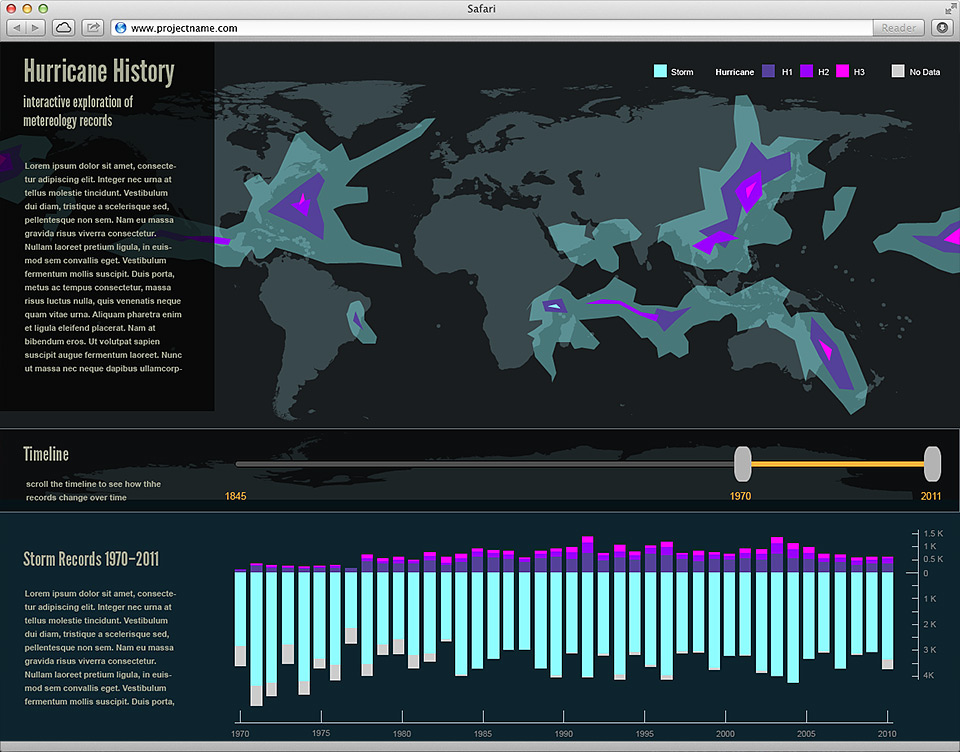
This is my initial mock I had for the visualization. I thought it would be nice to show you the process. Hope you like it.

Thanks for scrolling to here!
If you like this project take a second to appreciate it.
Have a clear day :)


