Cryptocurrencies Overview
-
Information visualization for La Lettura, Il Corriere della Sera
29|04|18
A project by The Visual Agency
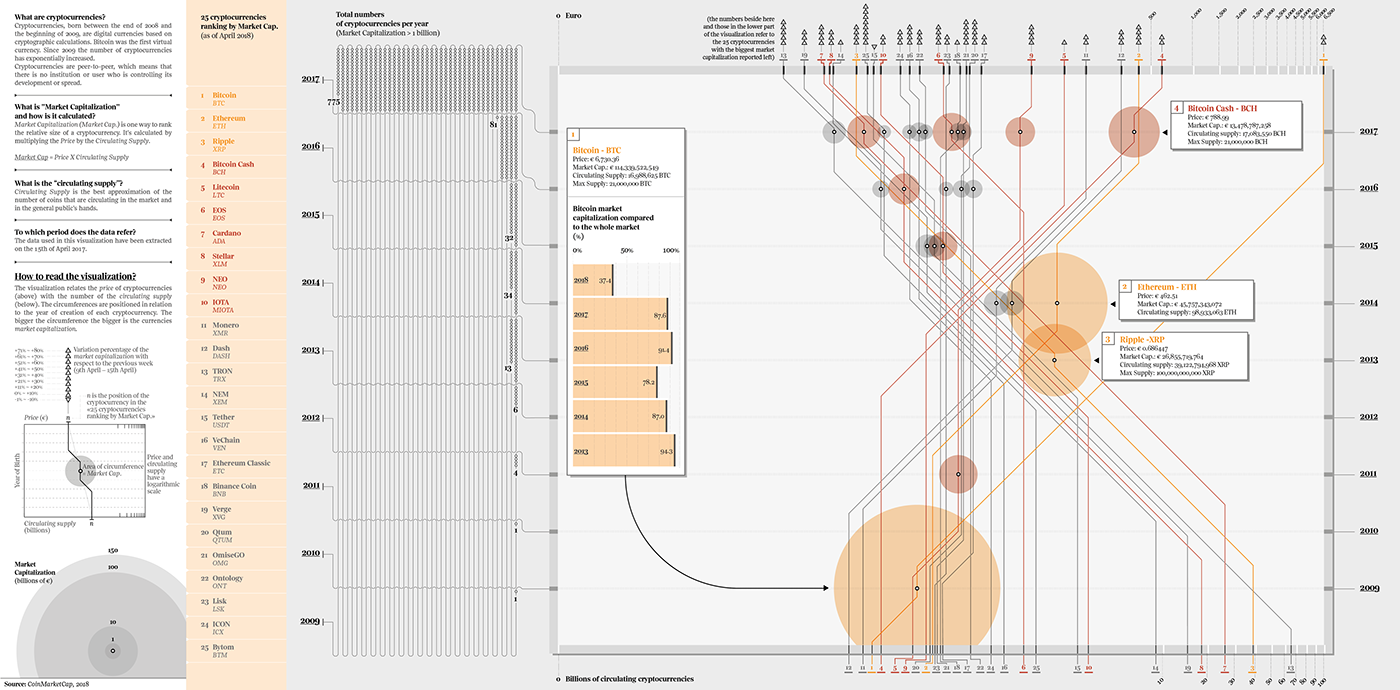
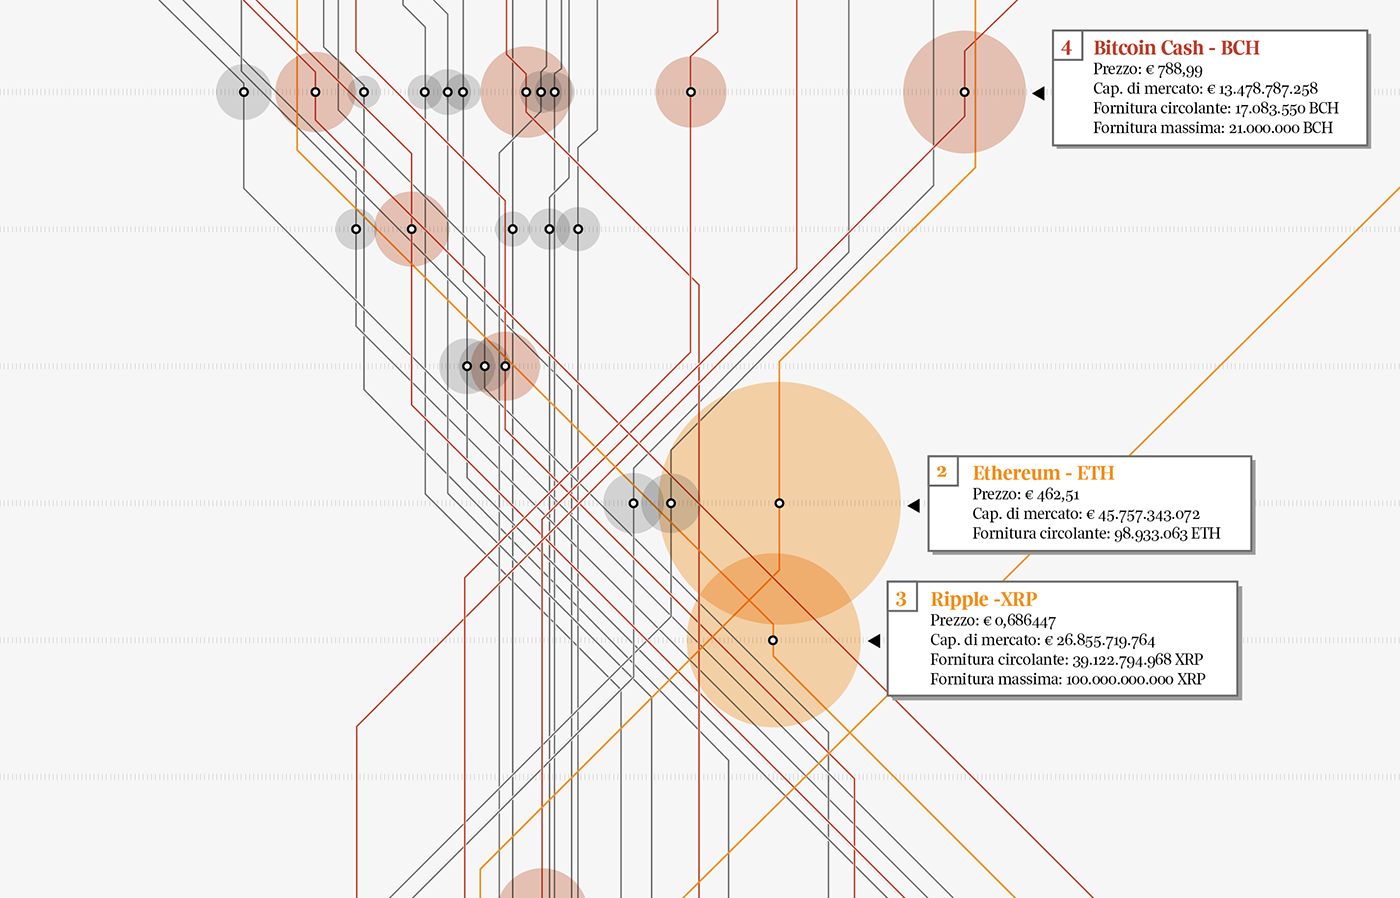
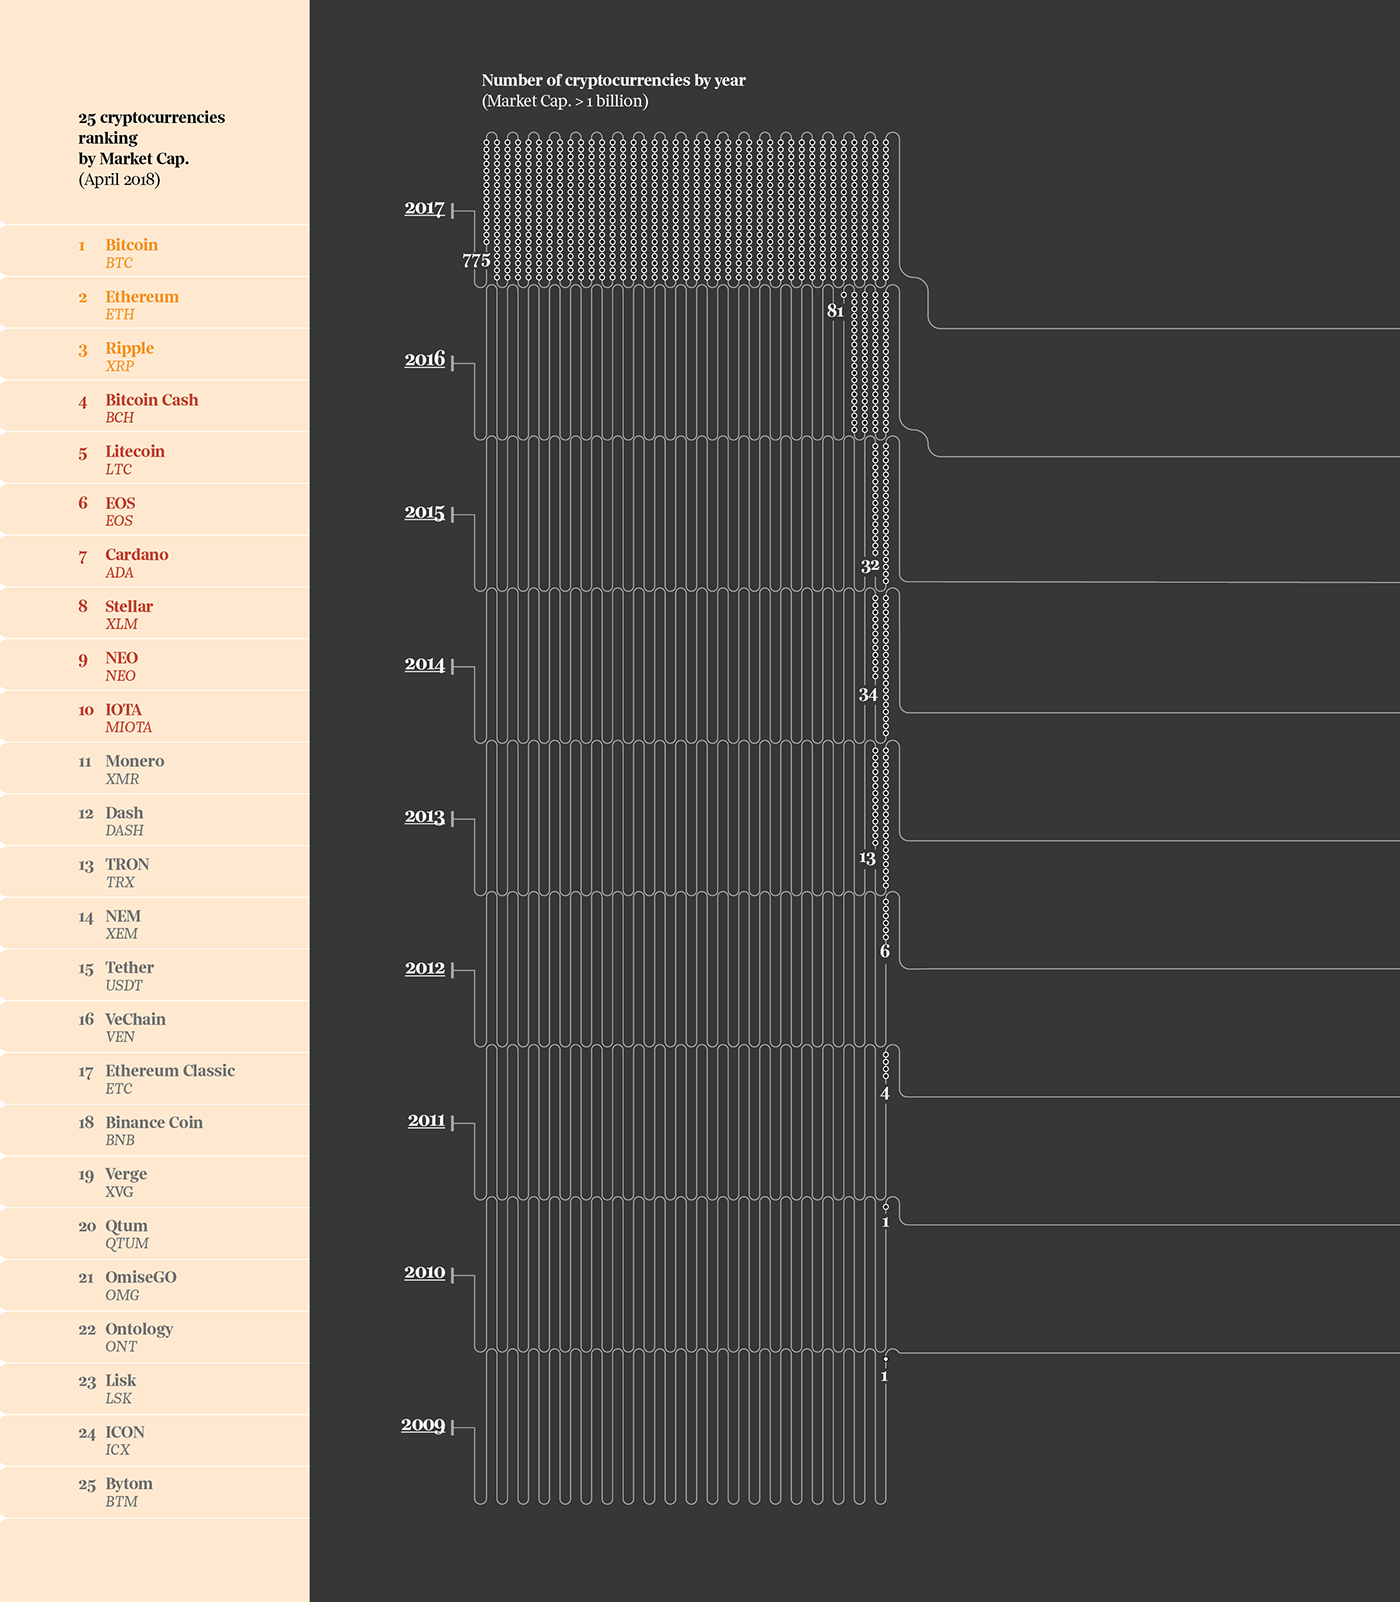
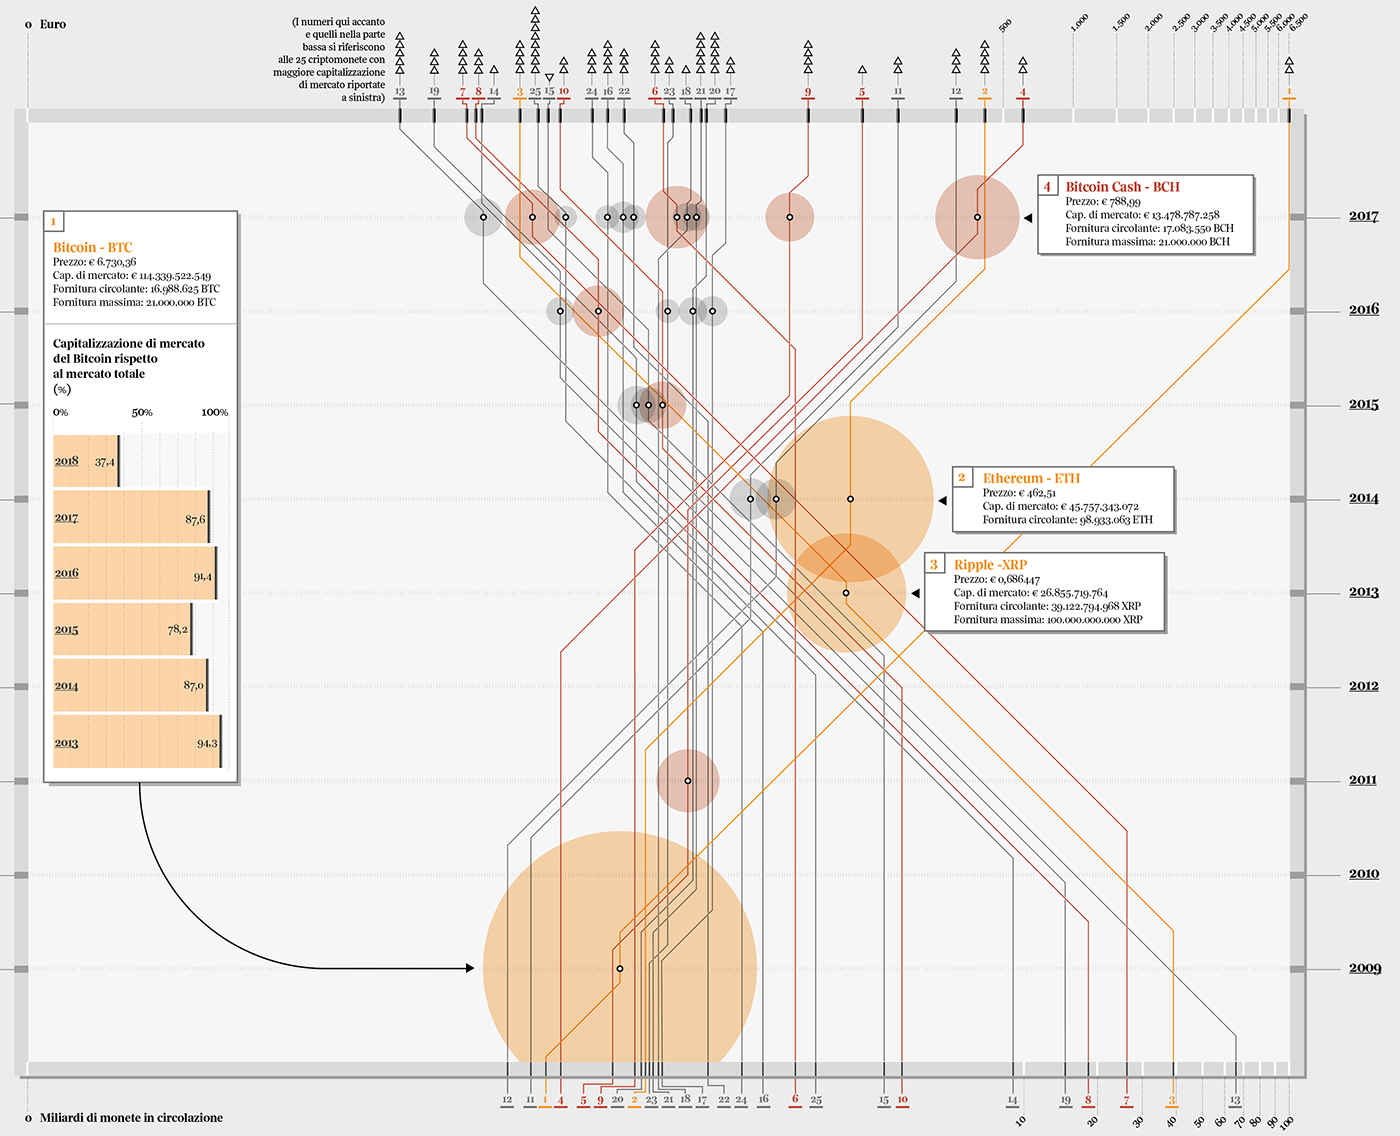
The visualization shows an overview of the cryptocurrencies market in April 2018.
The visualization relates the prices of cryptocurrencies (above) with the number of the Circulating Supply (below). The circumferences are positioned in relation to the year of creation of each cryptocurrency.
The bigger the circumference the bigger is the currencies market capitalization.
For more information about data and terminology of this viz check out the FAQ section of CoinMarket.com (https://coinmarketcap.com/faq/)
The data are referred to the 15th of April 2018
Sources:CoinMarketCap
How to read it?

Thank you

