F i f t y s h a d e s o f b l a c k m a r k e t
V I S U A L D A T A # 3 0 0
L A L E T T U R A - C O R R I E R E D E L L A S E R A
A u g u s t 2 7 t h , 2 0 1 7
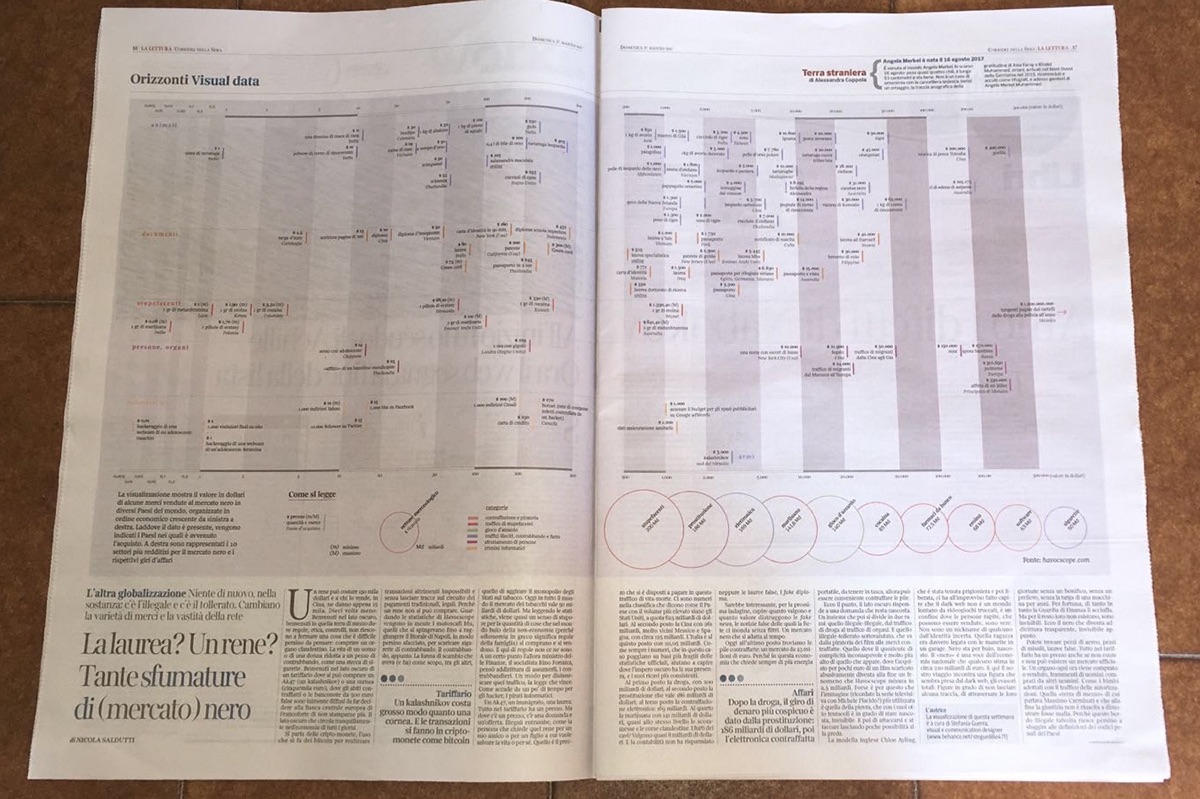
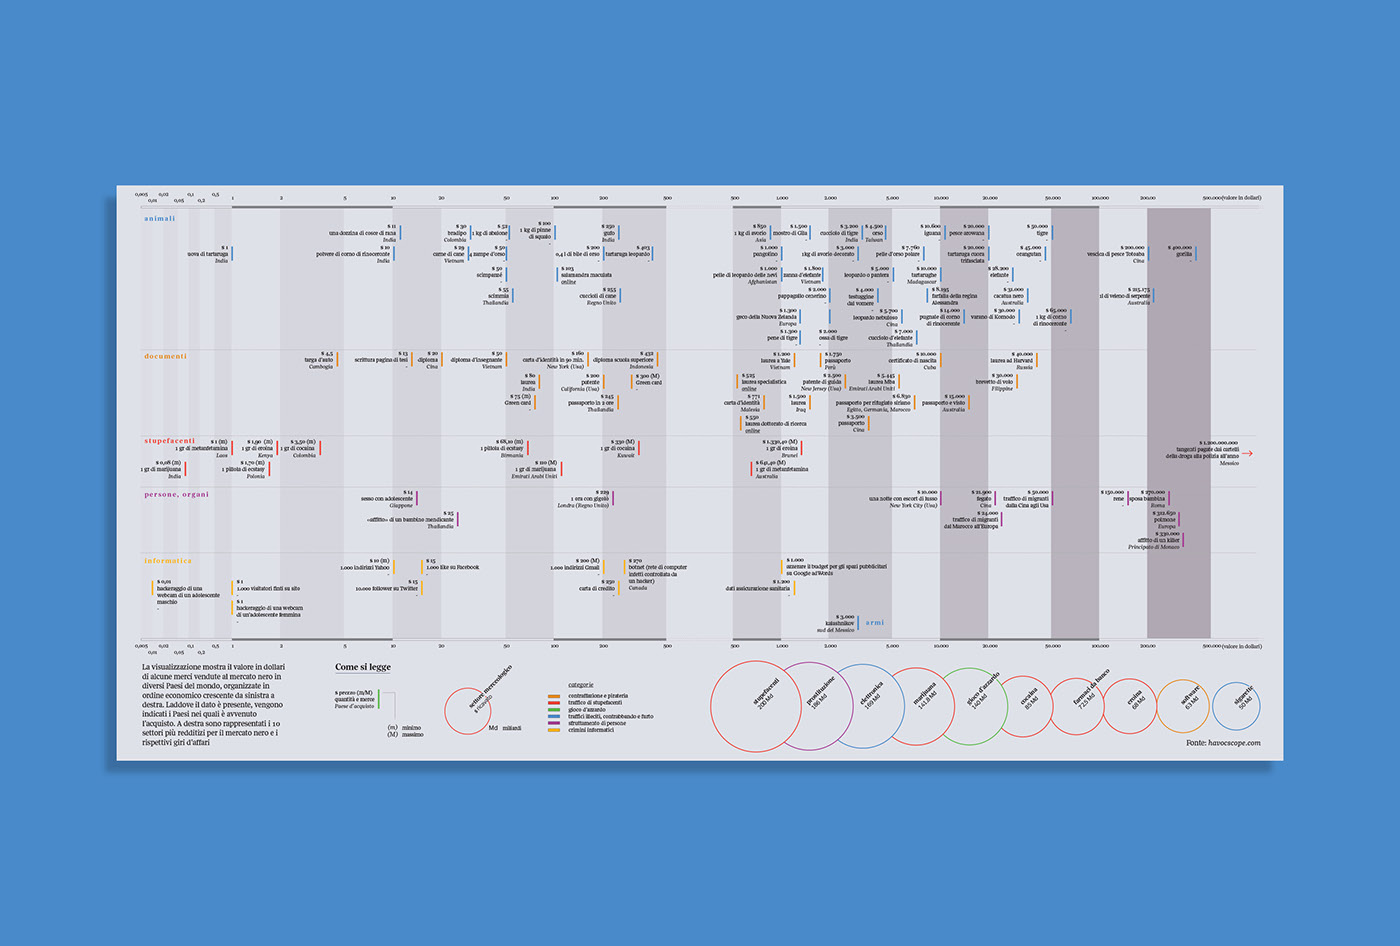
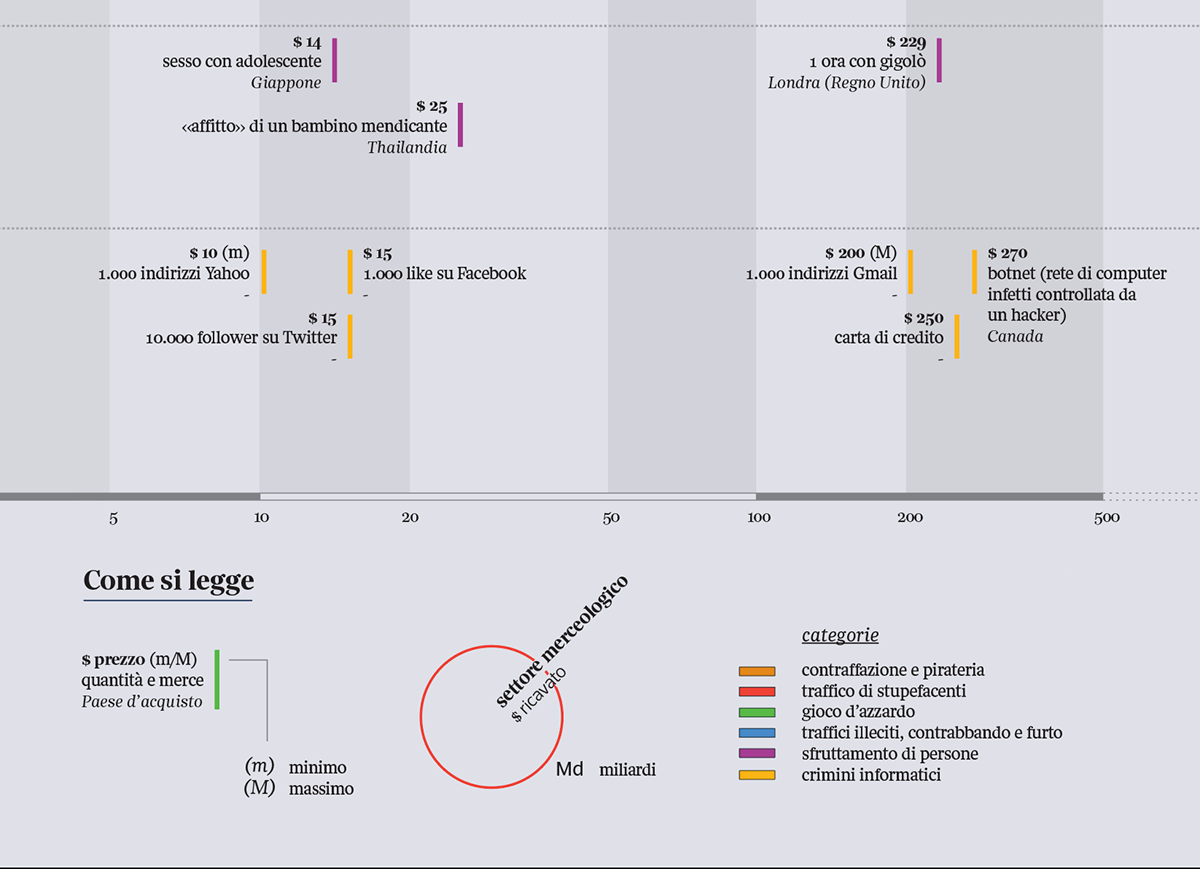
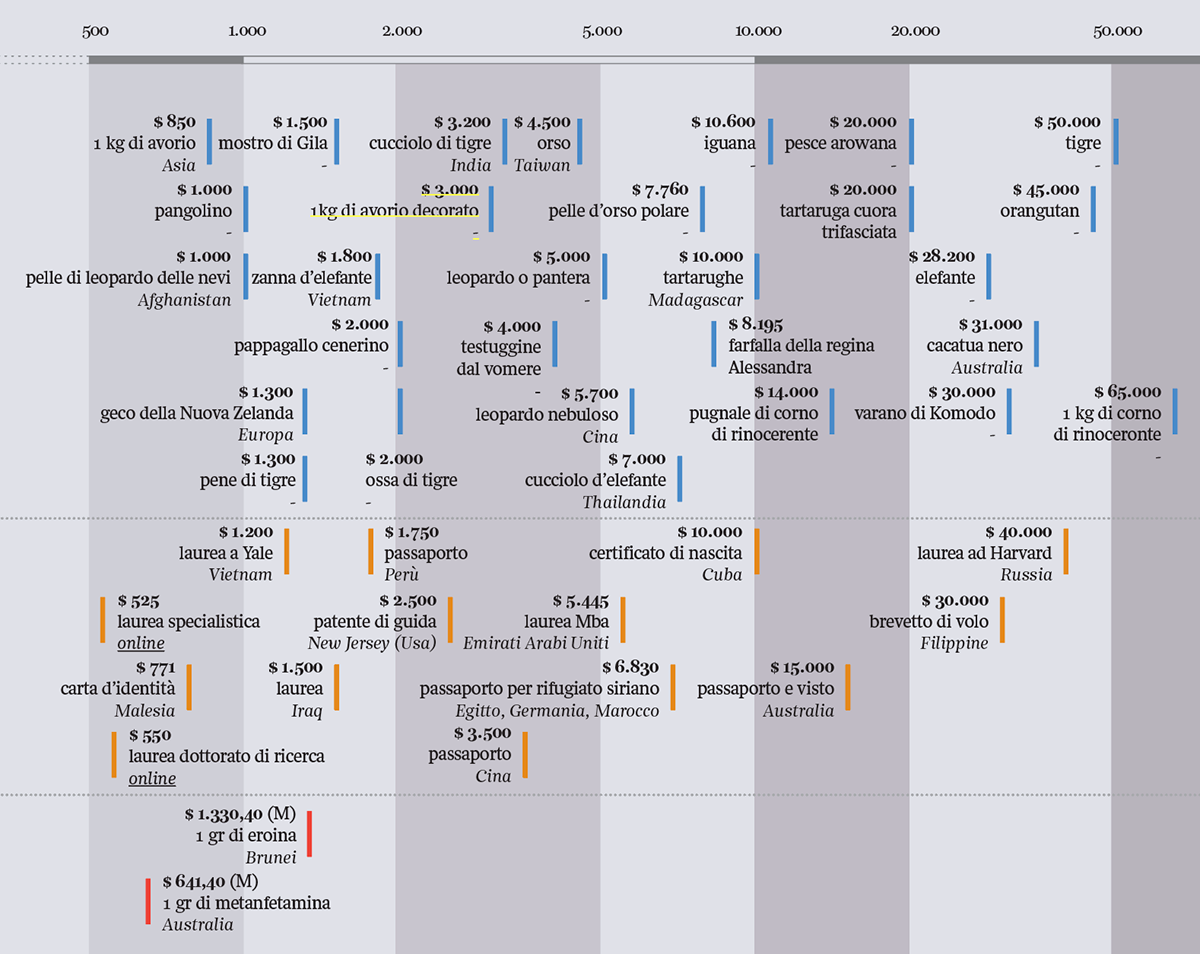
The visualization represents the prices ($ US) of several sets of illicit goods, around the world, organized from left to right according to their economic value. Whenever possible, it’s given the Country of purchase. On the right is shown the top 10 most profitable sectors.
Sources: havocscope.com
If you want a print of the artworks feel free to contact me!
T H E P R O C E S S
- data collection and analysis -

- visual representation -