

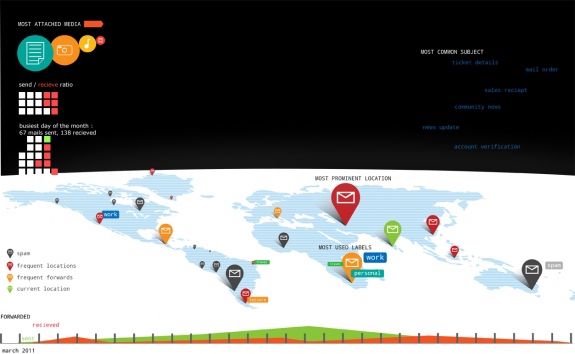
A screen for visualizing a native mail client and plotting location onto a map along with a few user generated stats.
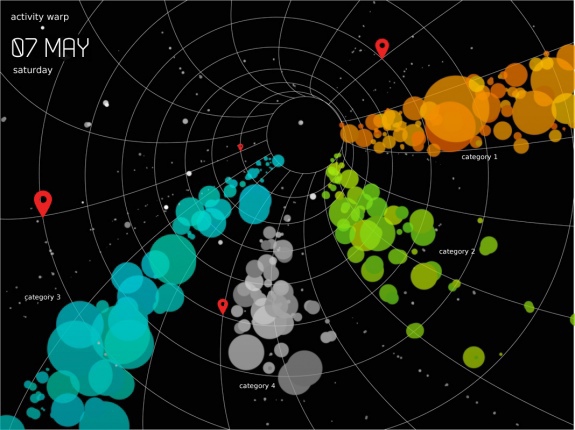
An activity plot, animated screen for rendering RAM usage based on applications for mobile deivces.
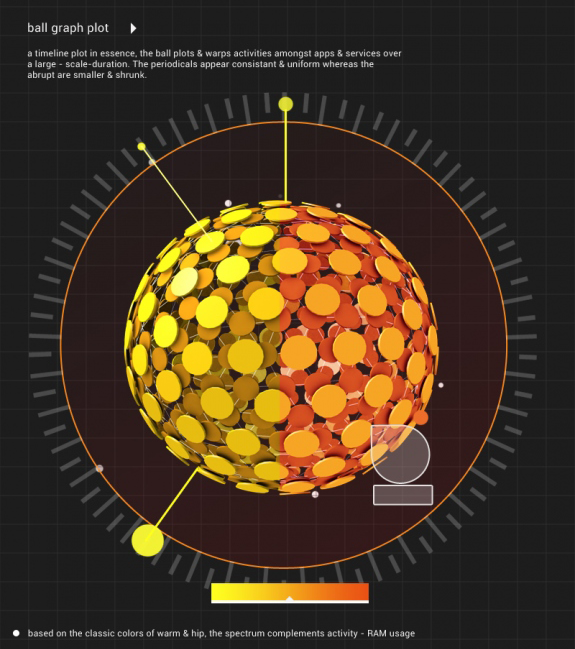
A 3d data -plot wrapped around a sphere, ..(density plot) for denoting time vs activity
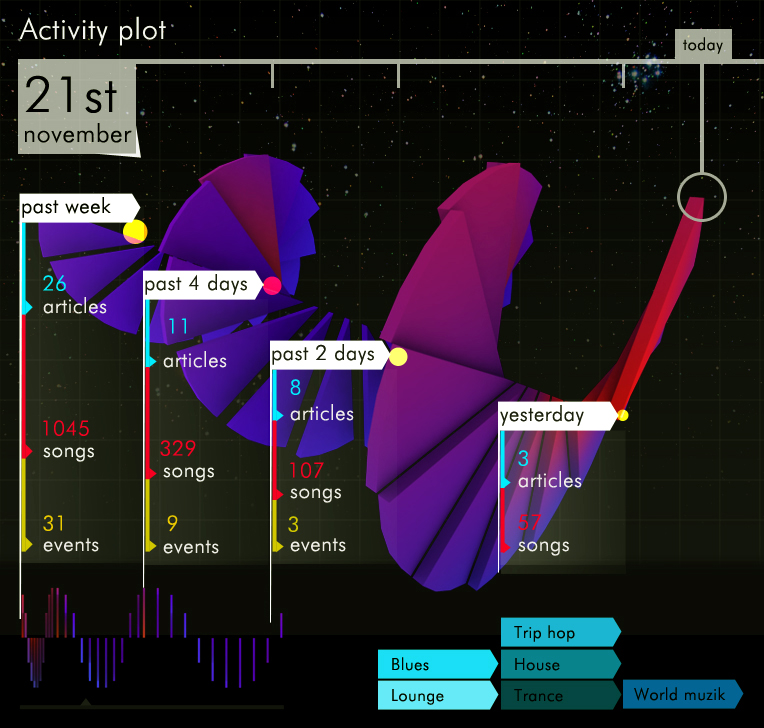
A screen UI for mobile device, ..frequency plot for user history mapped onto a 3d spiral

3D explorations for a histogram, curve plot and a spiral graph,.
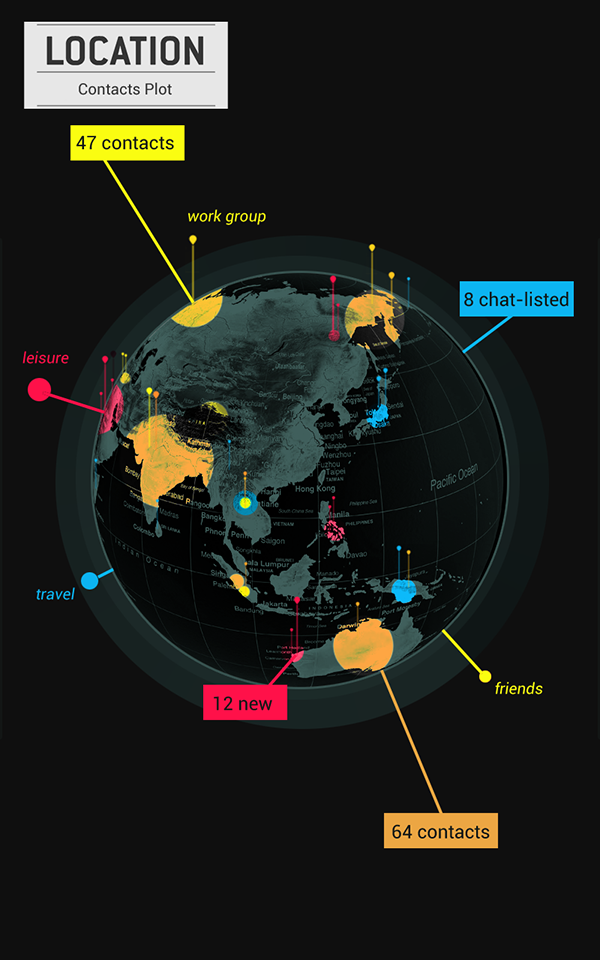
A screenshot for mapping information along a globe with contacts and tweet hashtags.
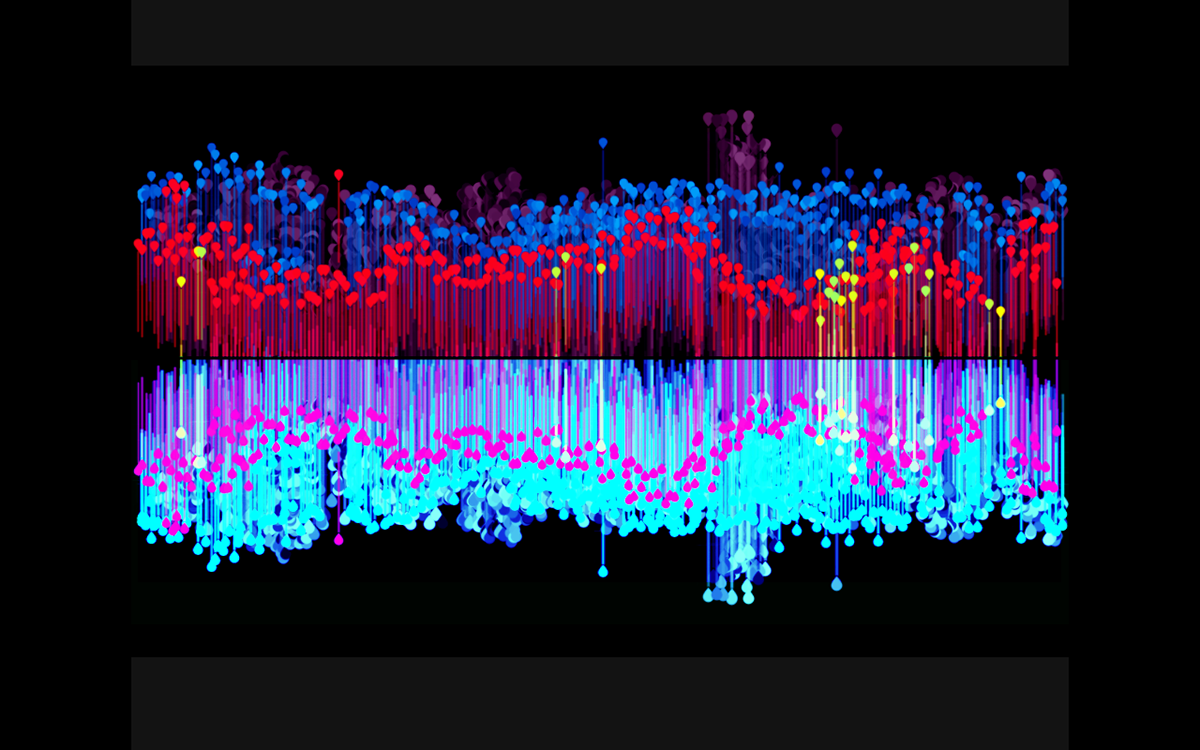
Muzik Visualization screen saver :)