


Micro SE1
Do incidents of crime and fire affect the dweller’s well being? Does an increase in fear of crime or anxiety affect the mortality rates? This data visualisation envisions the SE1 area as a living organism and analyses the varying mood of the area depending on different elements within it. Identifying Well- being, Crime, Fire and Mortality as a set of interconnected factors that contribute to the changing image of the neighbourhood, this project visually explores and compares these affecting factors to get a micro perspective into the evolution of SE1.
Concept and execution: Valeria Conti, Priyanka Poddar, Michelle Chong.
This Project was developed for the SE1 Data Stories exhibition at London College of Communication as part of the London Design Festival 2016. "With London College of Communication at the heart of what is a major regeneration of the SE1 postcode, SE1 Data Stories explores the area through the prism of data."
Check out more about the event here

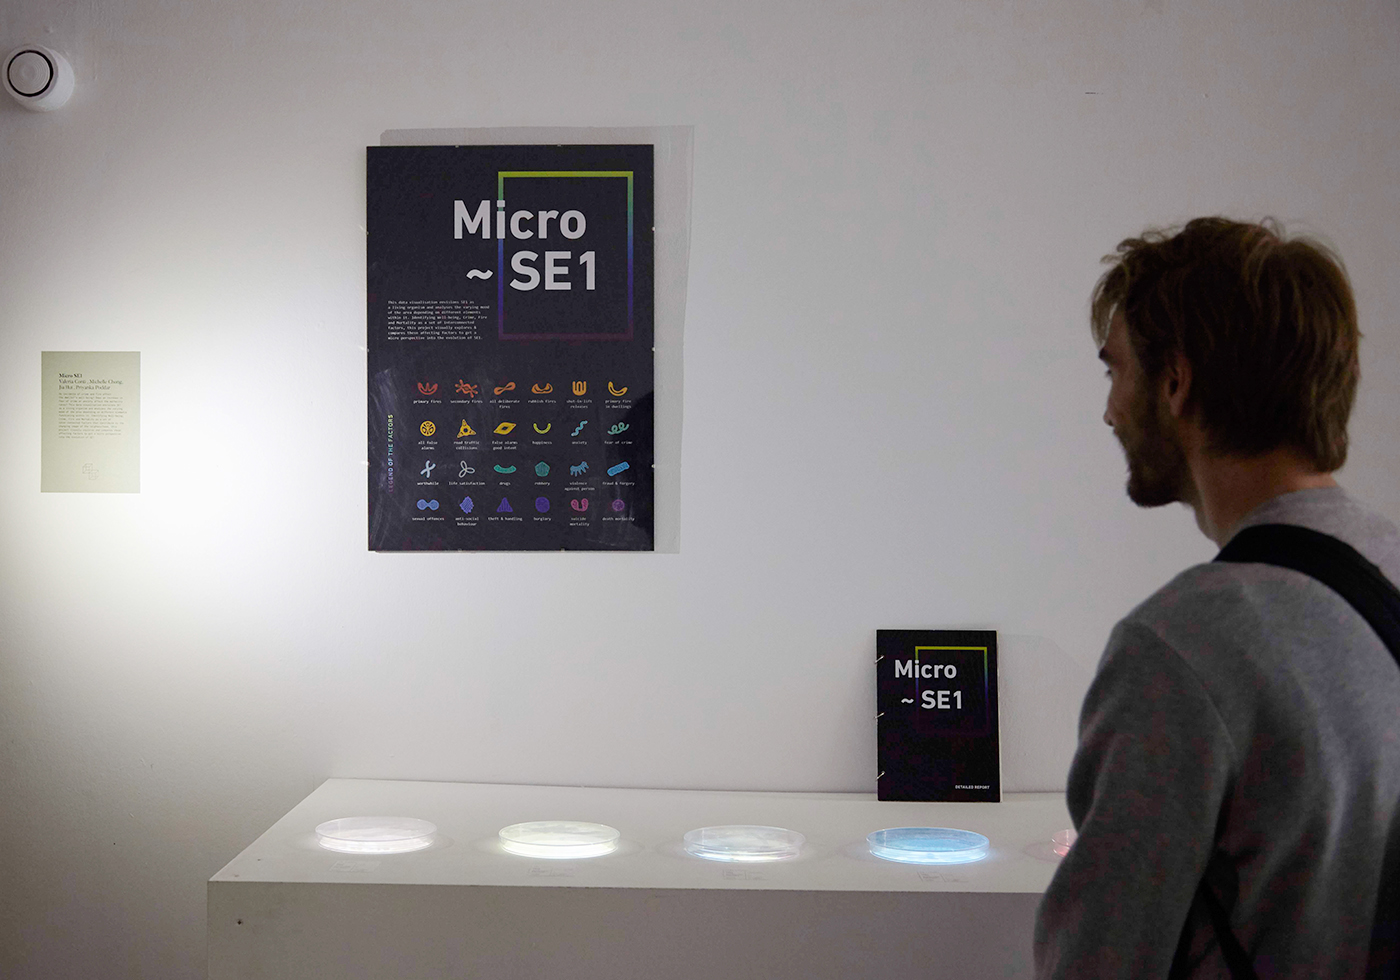


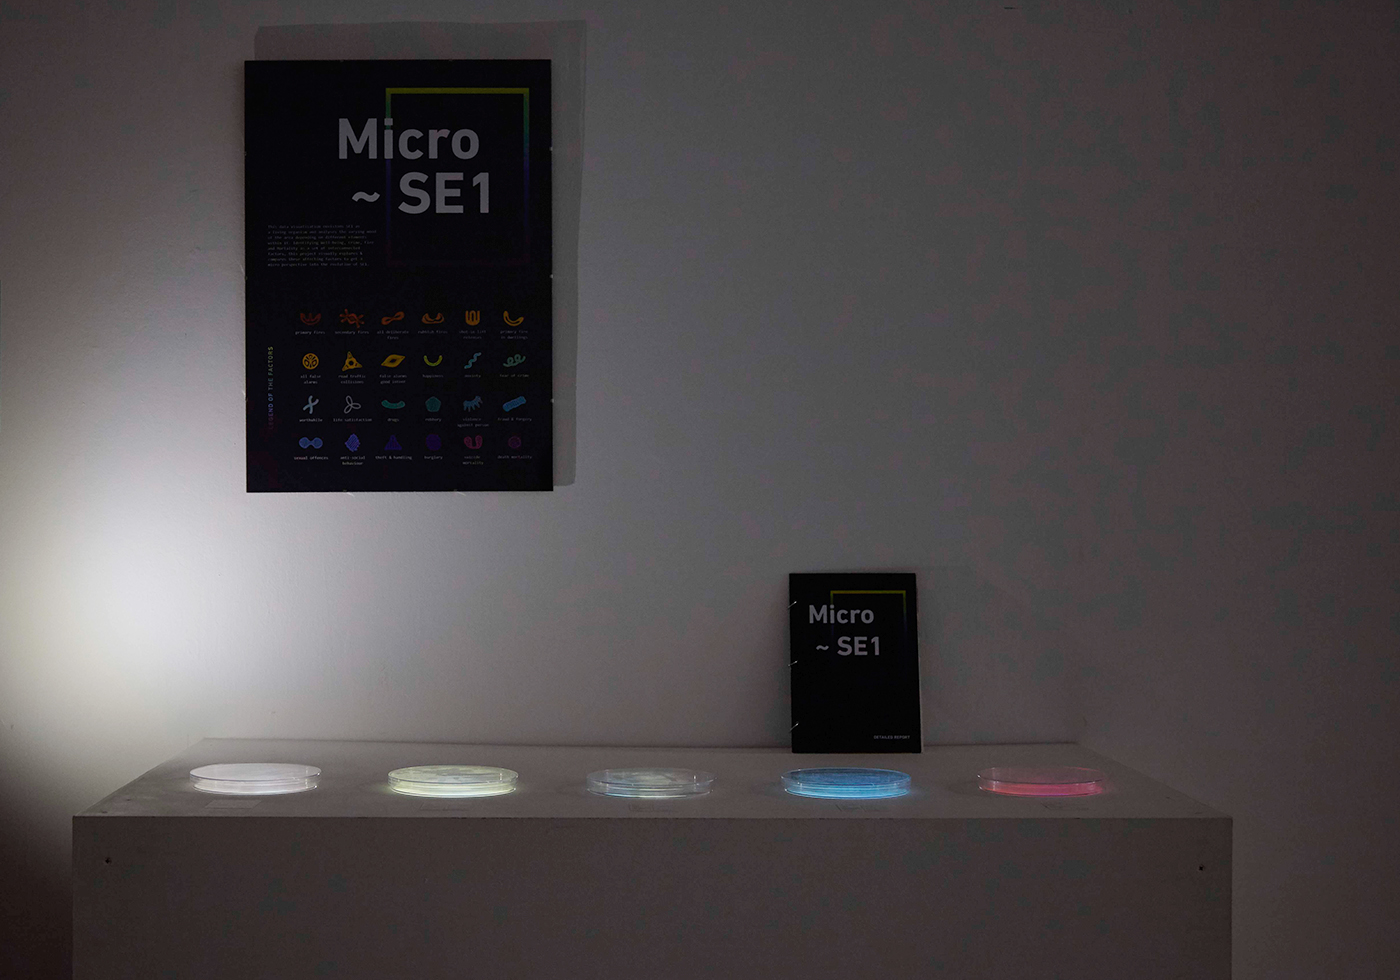
Accompanying this set of data visualisation was a scientific manual & poster that provided more information about the different organisms, the comparative analysis and the detailed numeric data collected over the
duration (2.5 months) of the project. It also acted as an aid for the audience to analyse and decipher the
visualisation better.


