Andy Kriebel together with Andy Cotgreave initiated a MakeoverMonday series to challenge their-selves and others to redesign a dataviz (you can find the project here: http://vizwiz.blogspot.nl/p/makeover-monday-challenges.html). They provide the original dataviz and the source (small) data. I'm participating with my own approach in Illustrator, trying to trigger myself into new/other graphical styles and/or forms. I'll try to include my sketches as well.
The data itself is mostly a small part of a bigger story and I didn't check up on all the background-info, sometimes even the statistics are questionable. Do consider these visualizations purely as an exercise and please do not communicate/share them as facts!
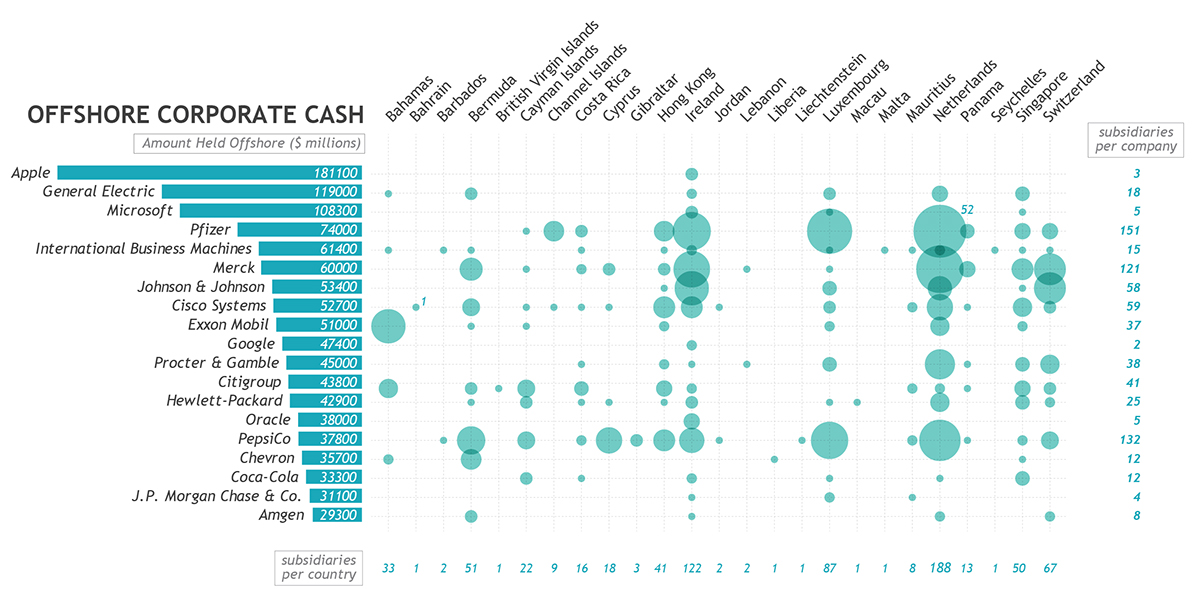
week 35: U.S. Corporate Tax Havens


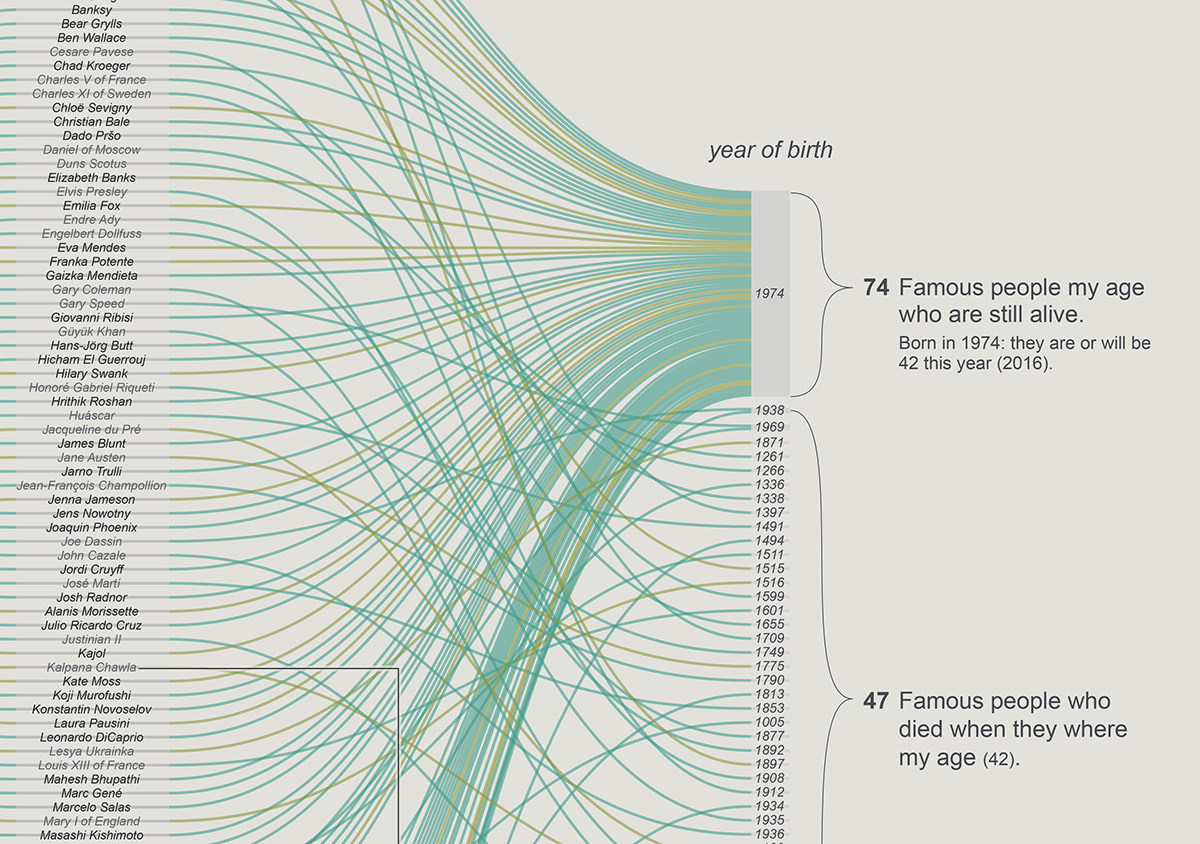
week 22: The History of Famous People

week 21: The Militarization of the Middle East
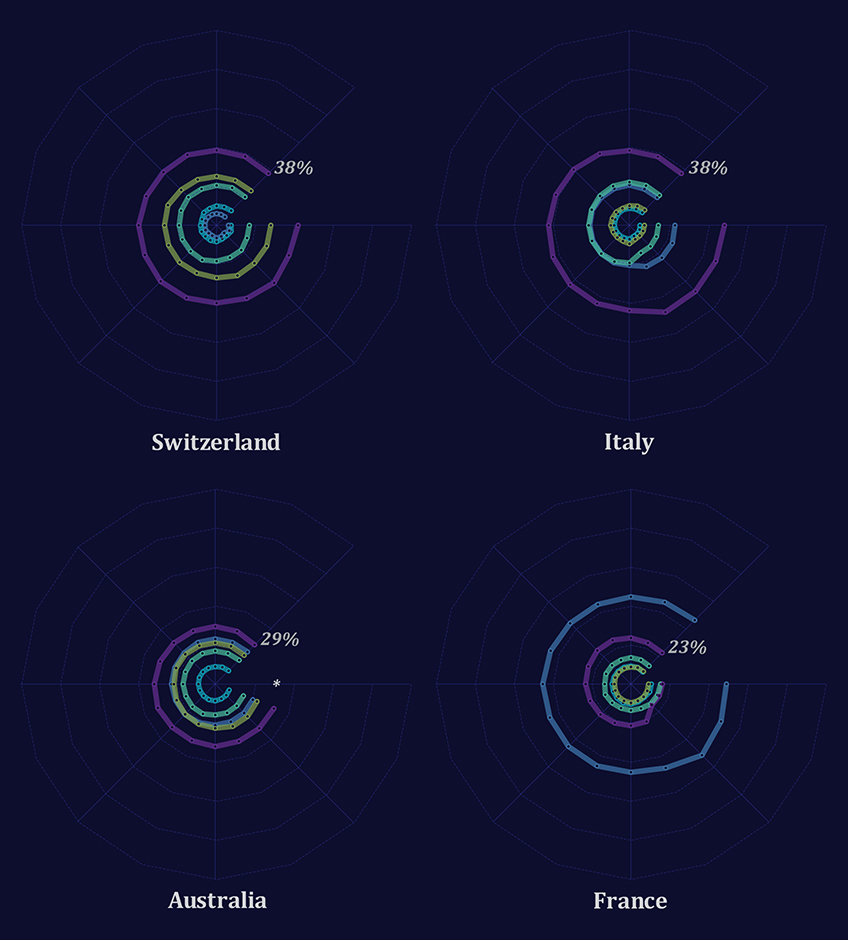

week 19: American Women Work Way More Than Their European Counterparts
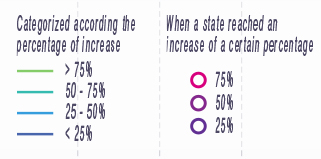
I've created a light and a dark version, which one do you prefer?
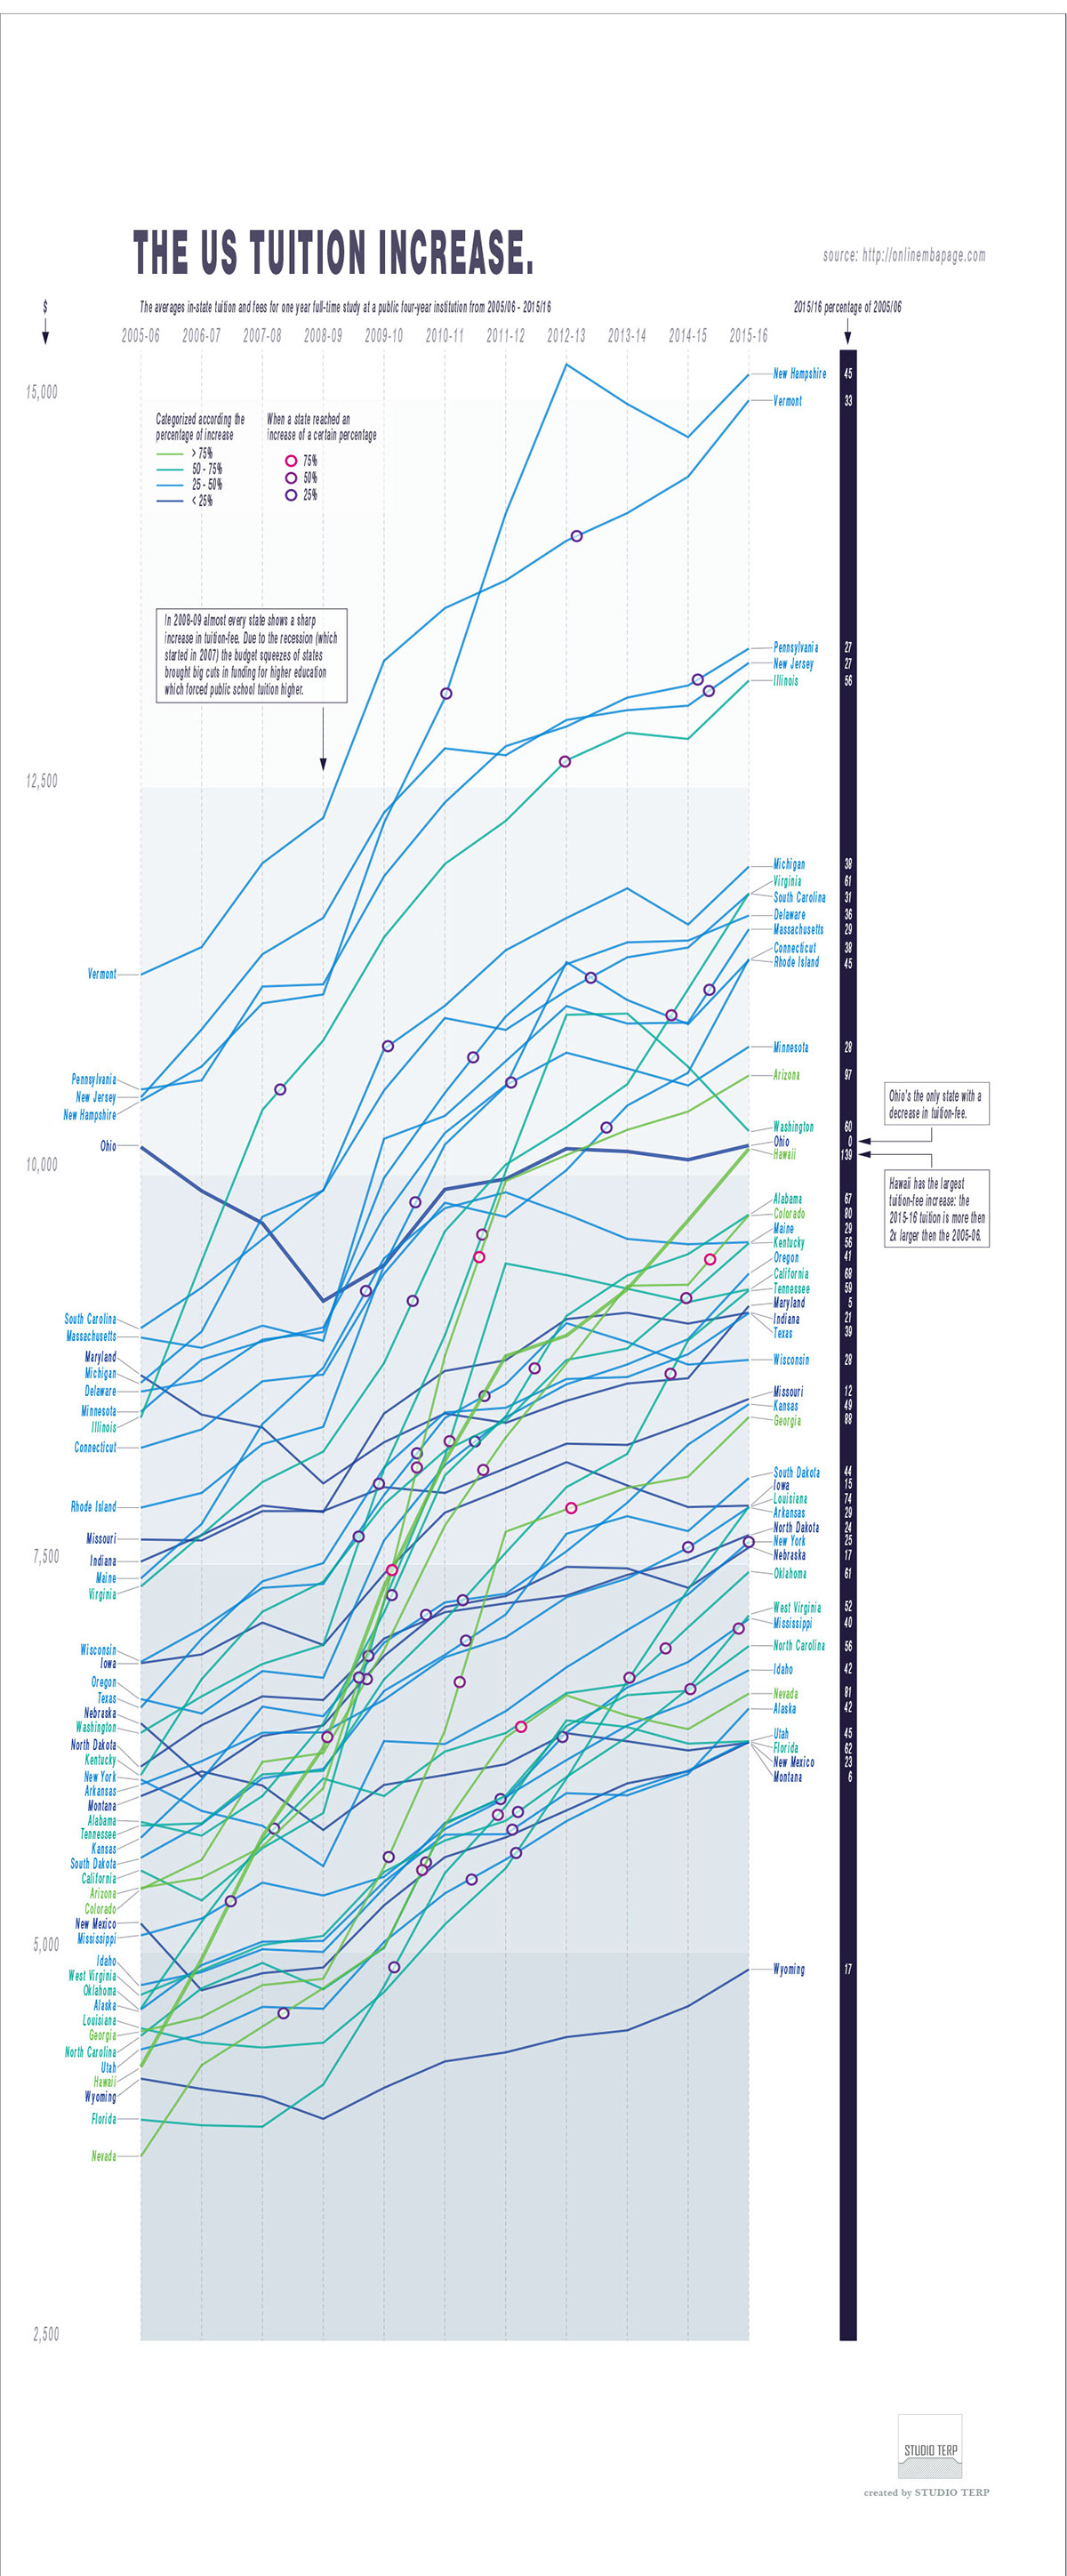


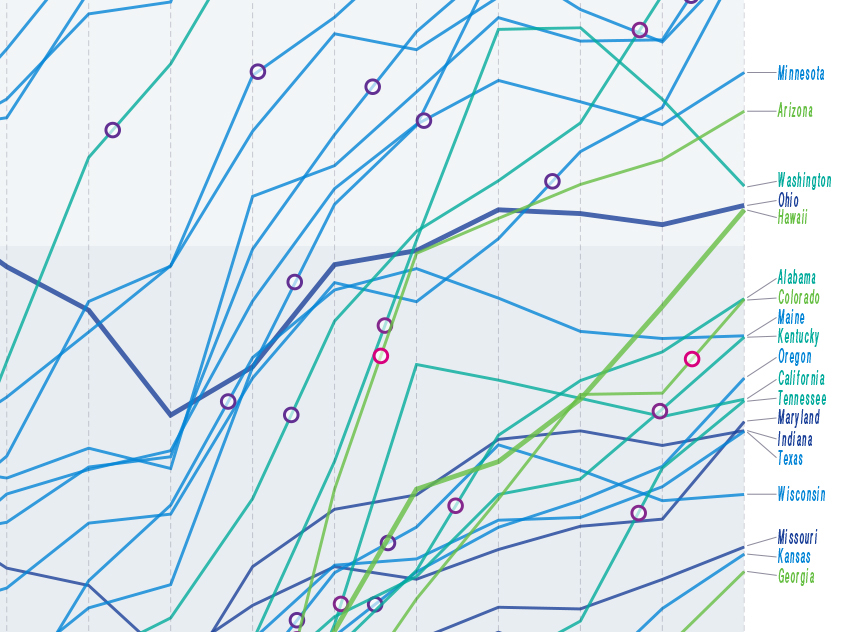
Week 18: Average Tuition in the United States

Week 17: Victims of the 21st-century Slave Trade (just he Africa data)

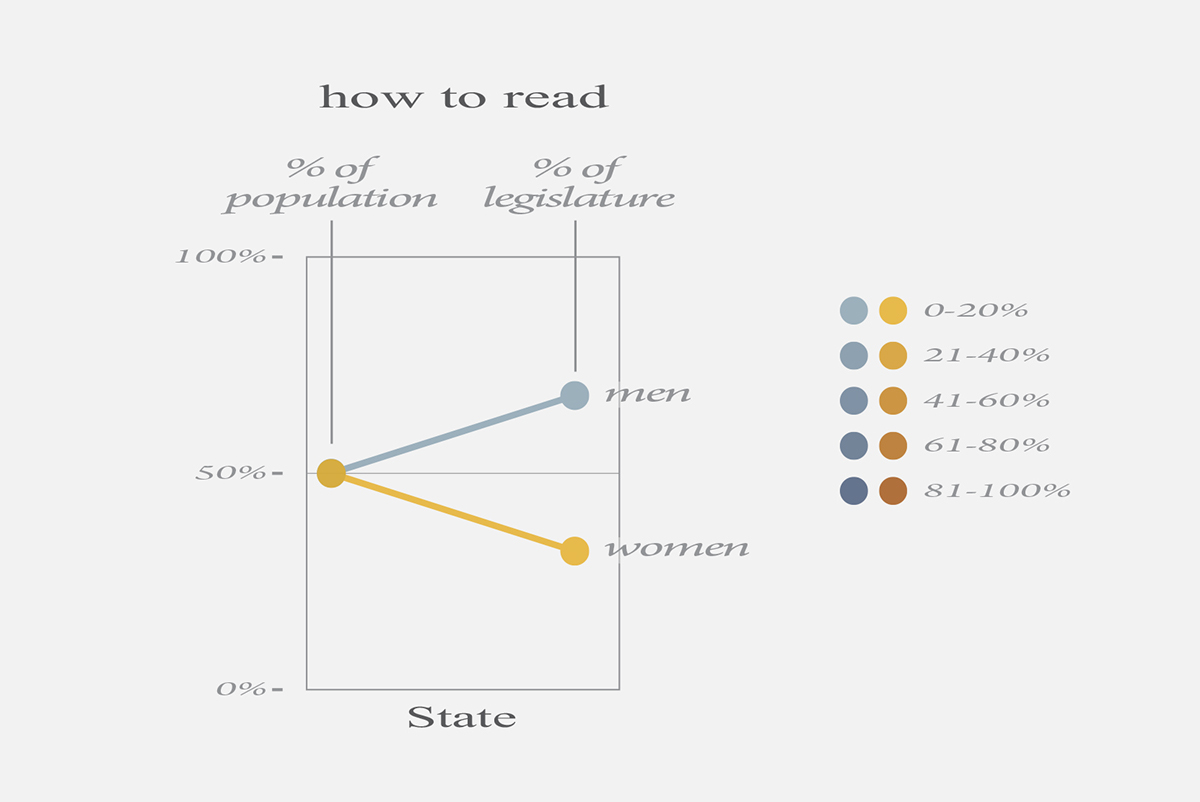
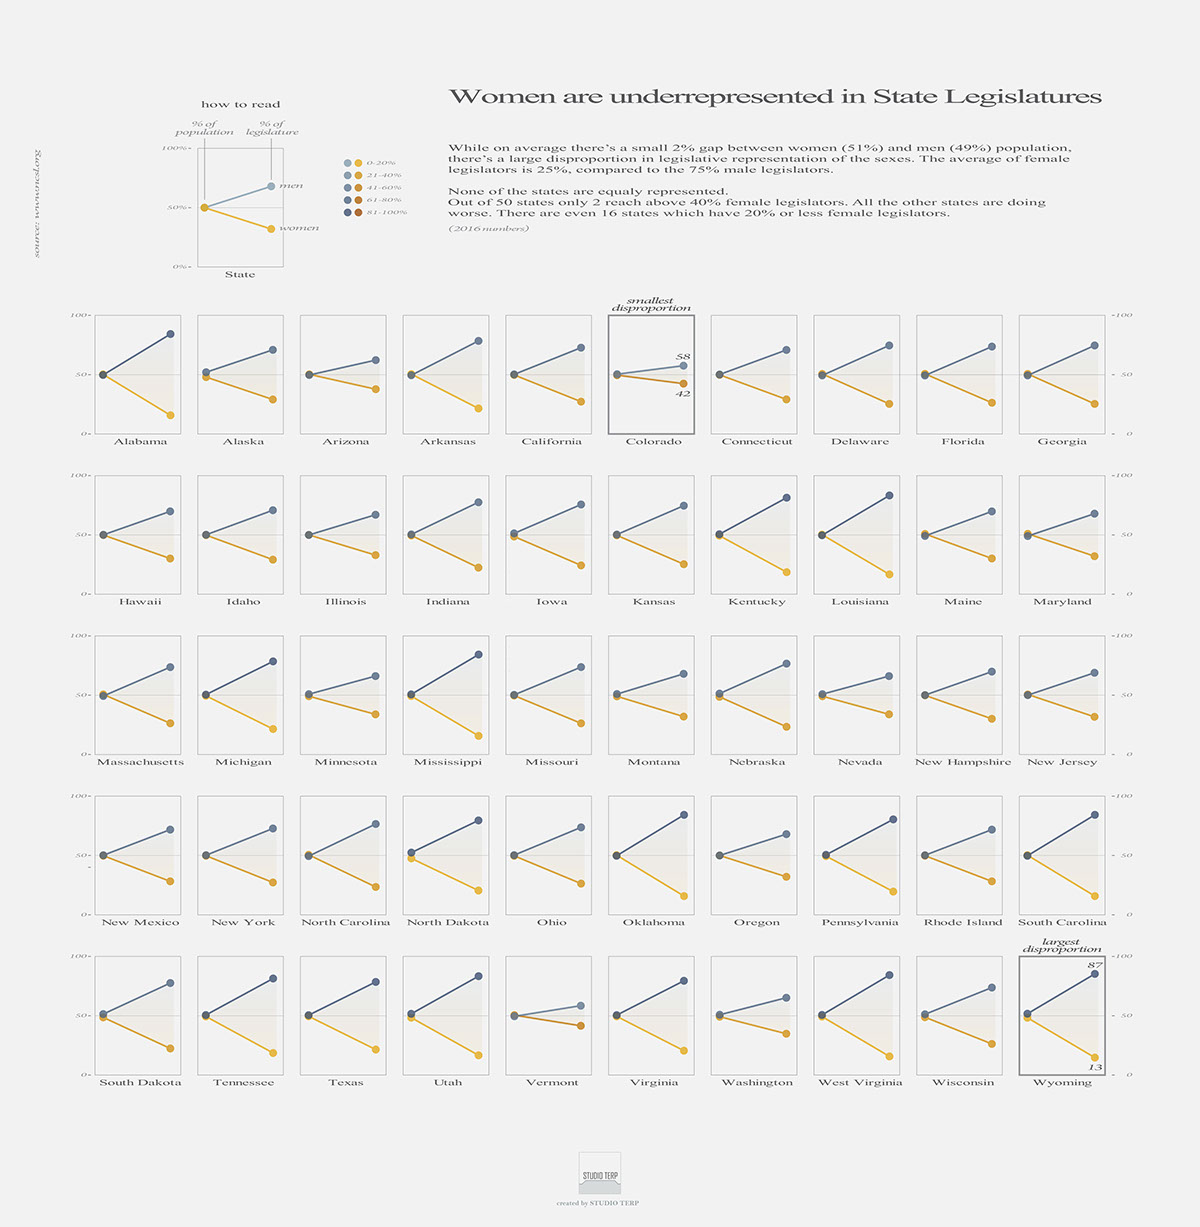
week 16: Women in State Legislatures
(Andy Kriebel created a Tableau version of this viz and shows and tells how-to on his blog

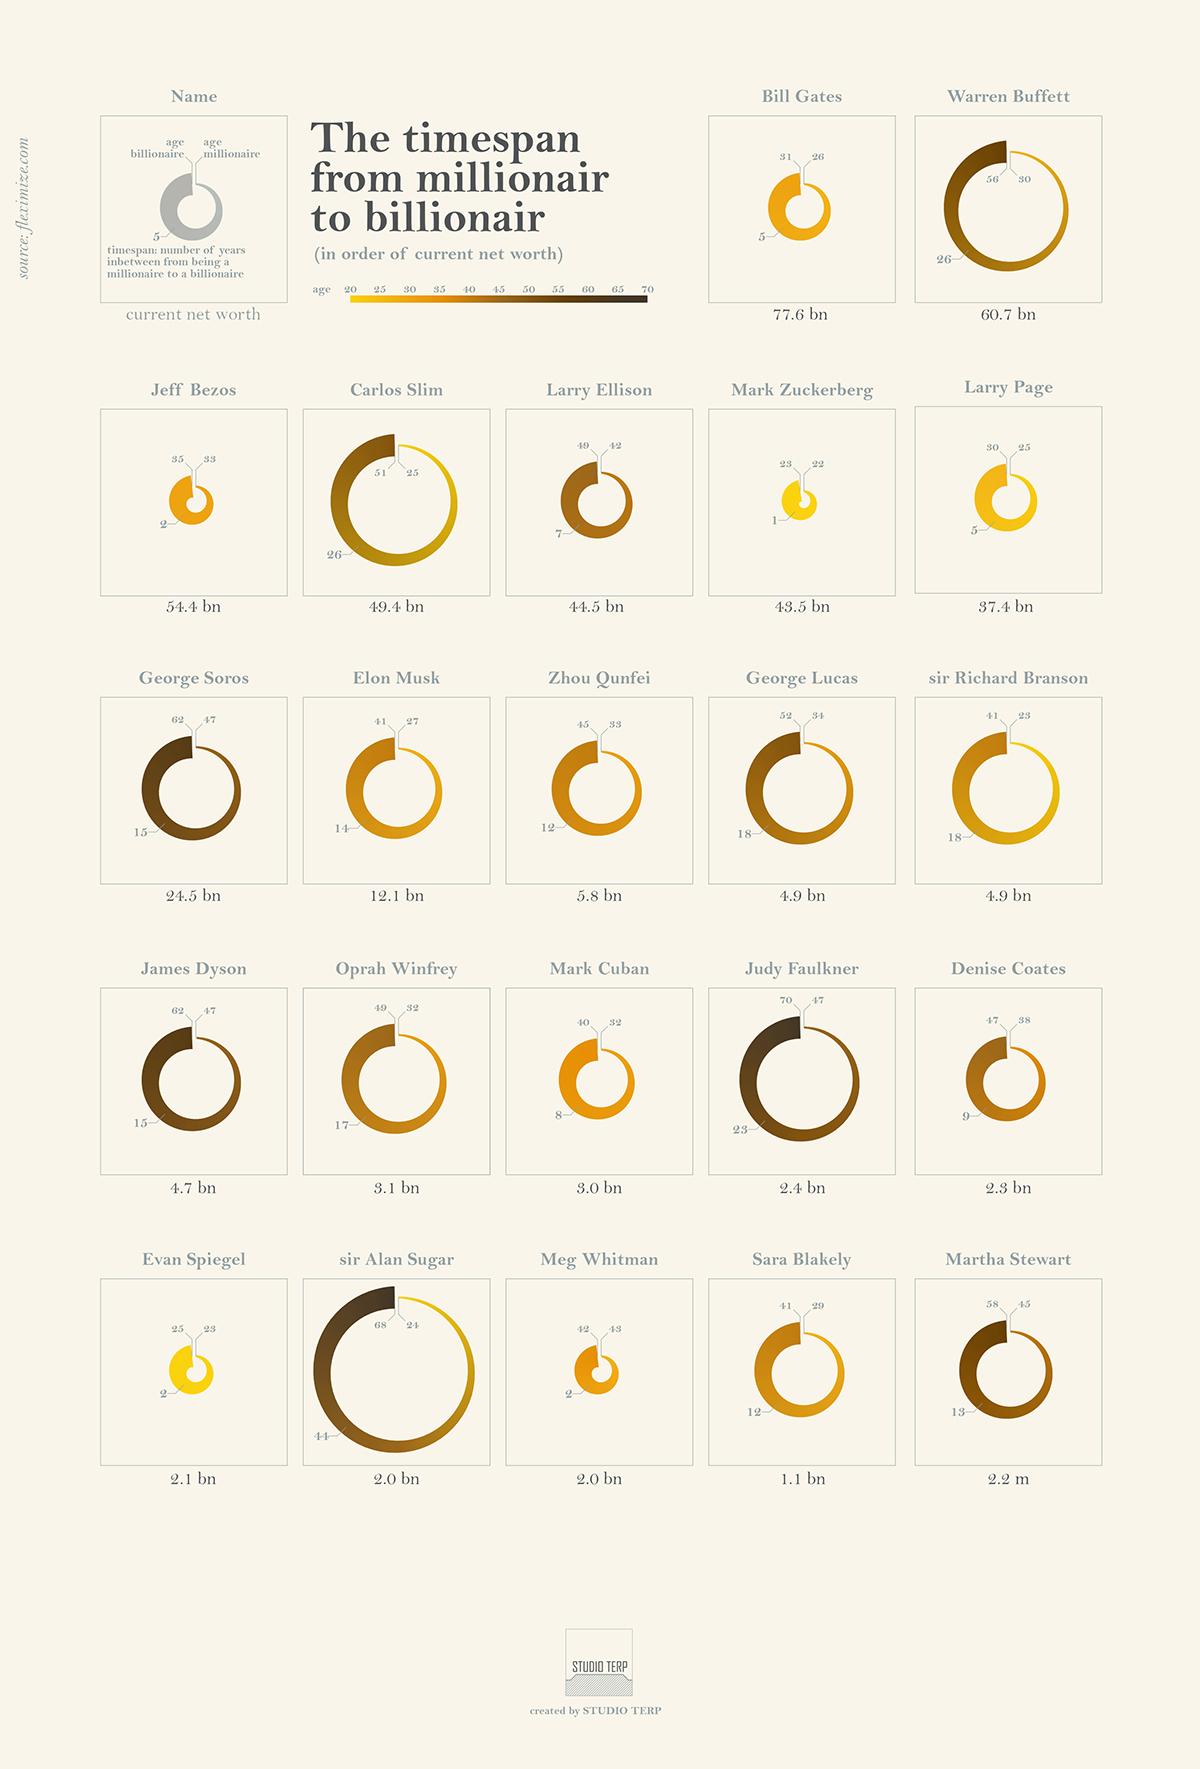
week 15: From Millions to Billions
(Adam E McCann created a Tableau version of this viz and shows how-to on his blog

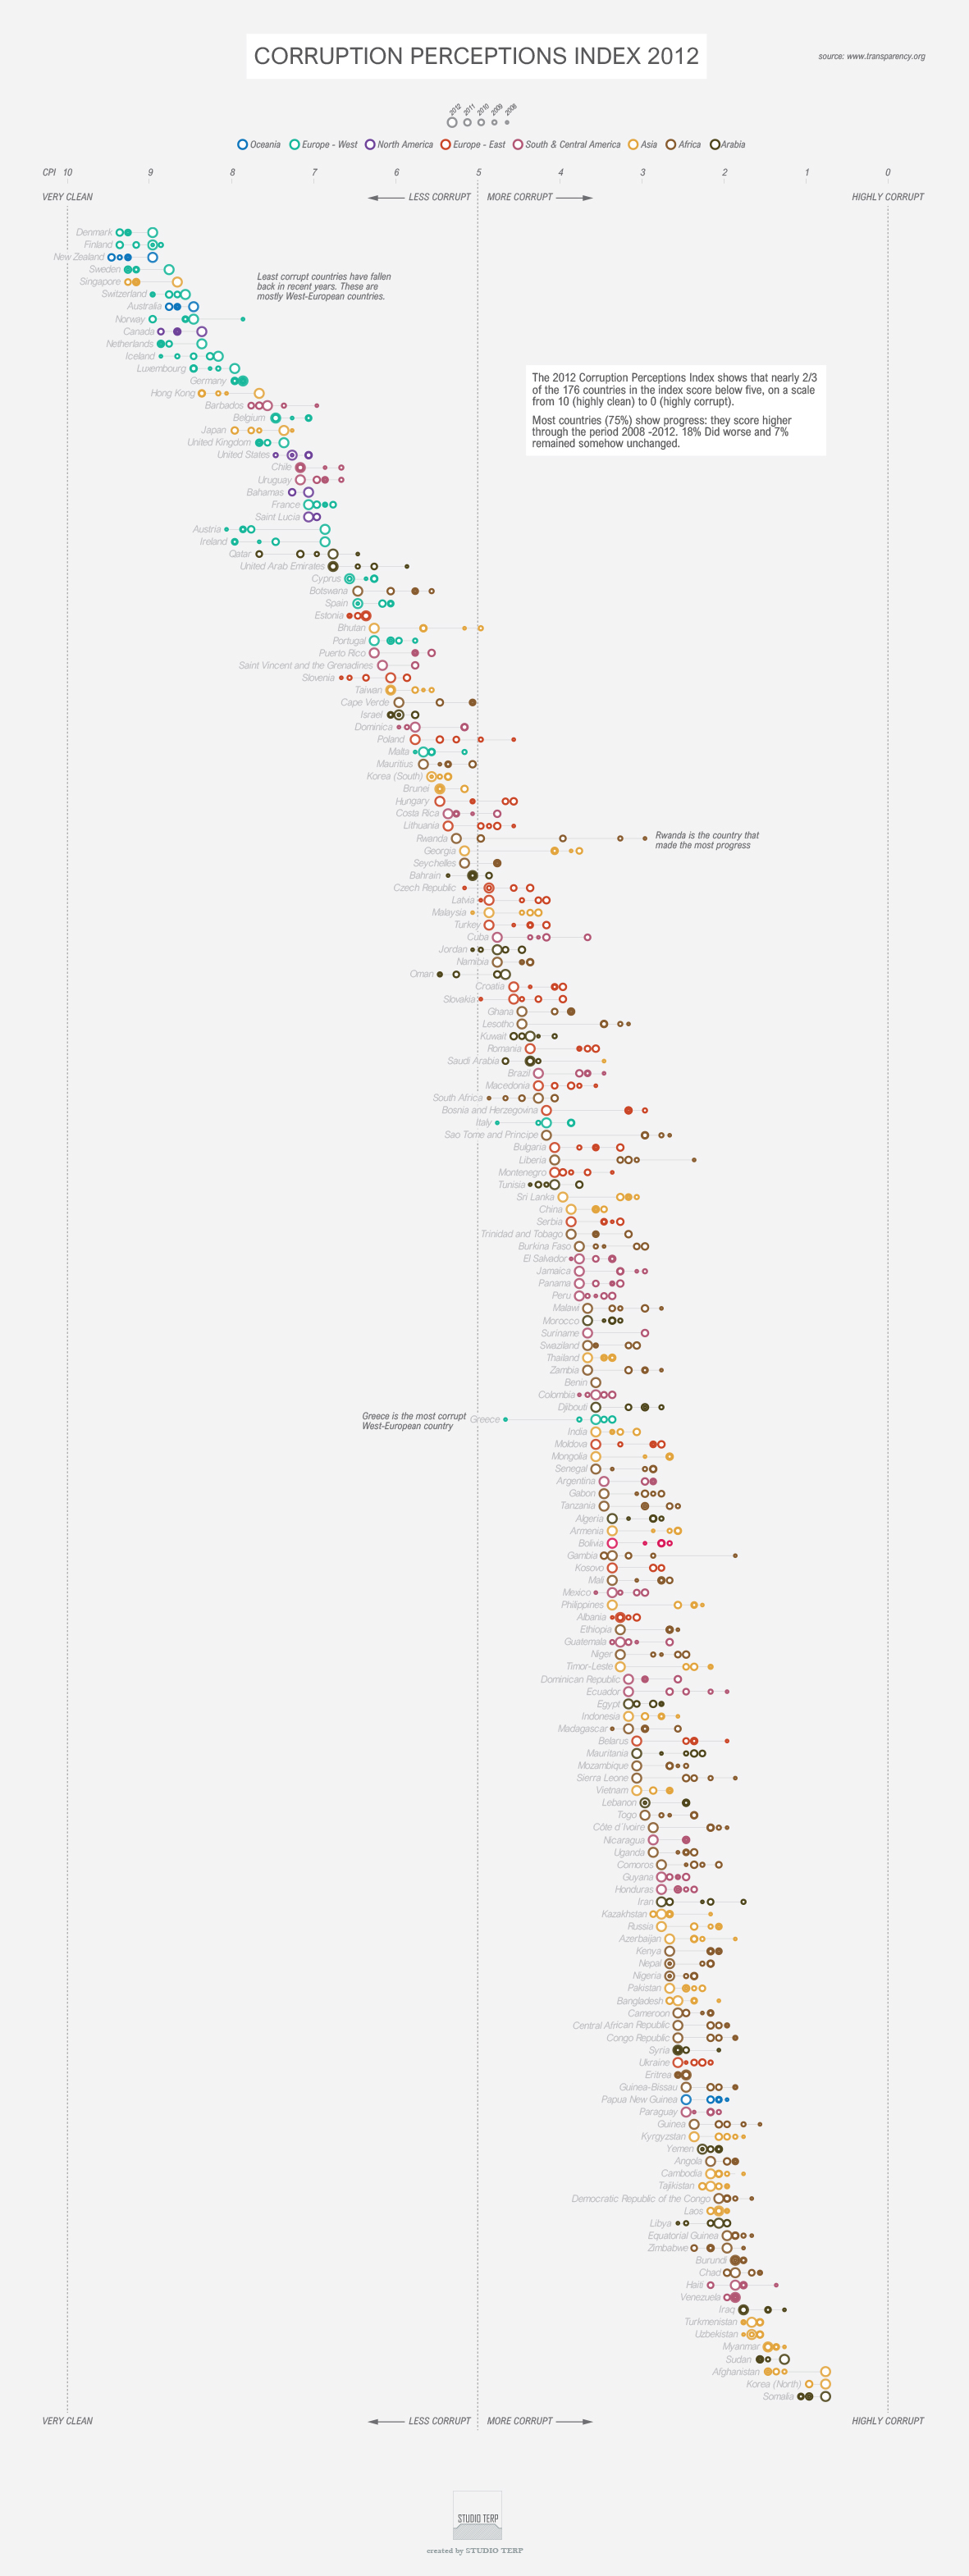
week 11: Transparency International: Corruption Perceptions Index
When you share my interests in dataviz, infographics and planning do follow me on Pinterest where you'll find lots of inspiration on these and related topics


