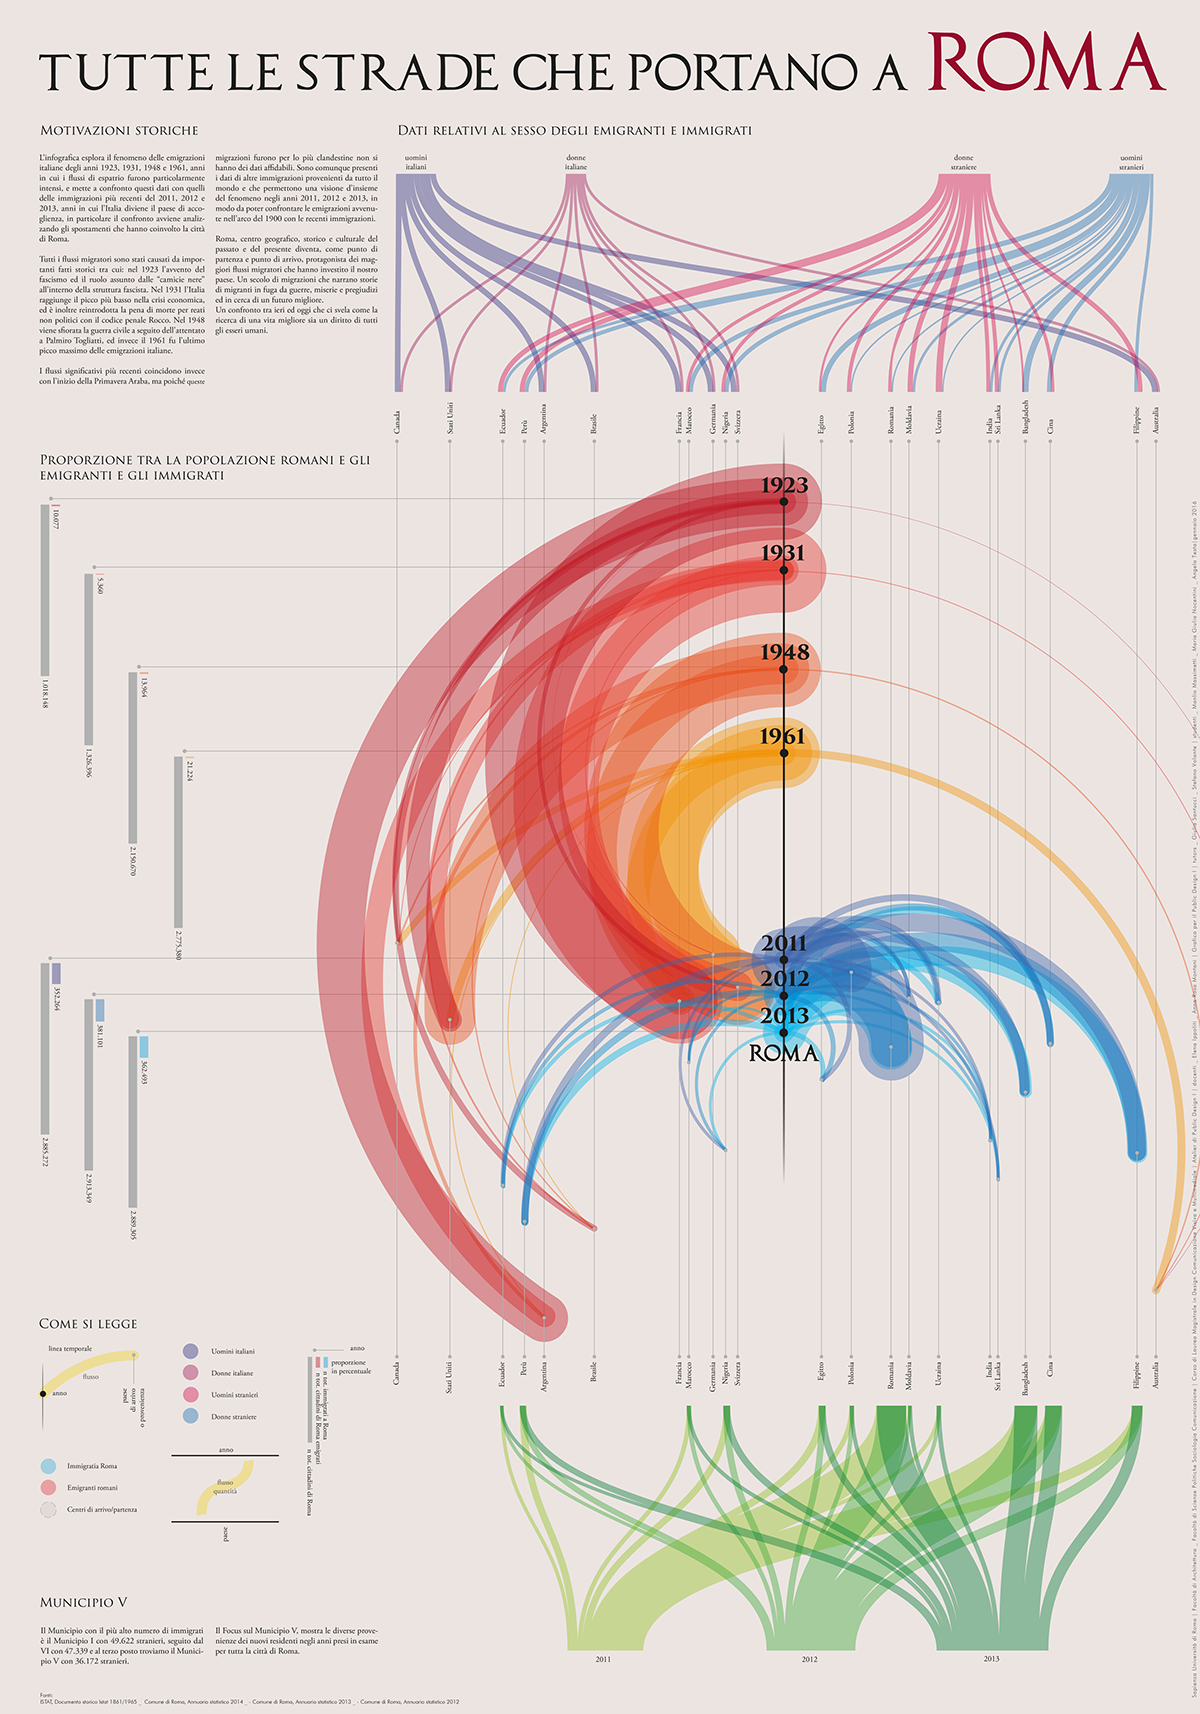
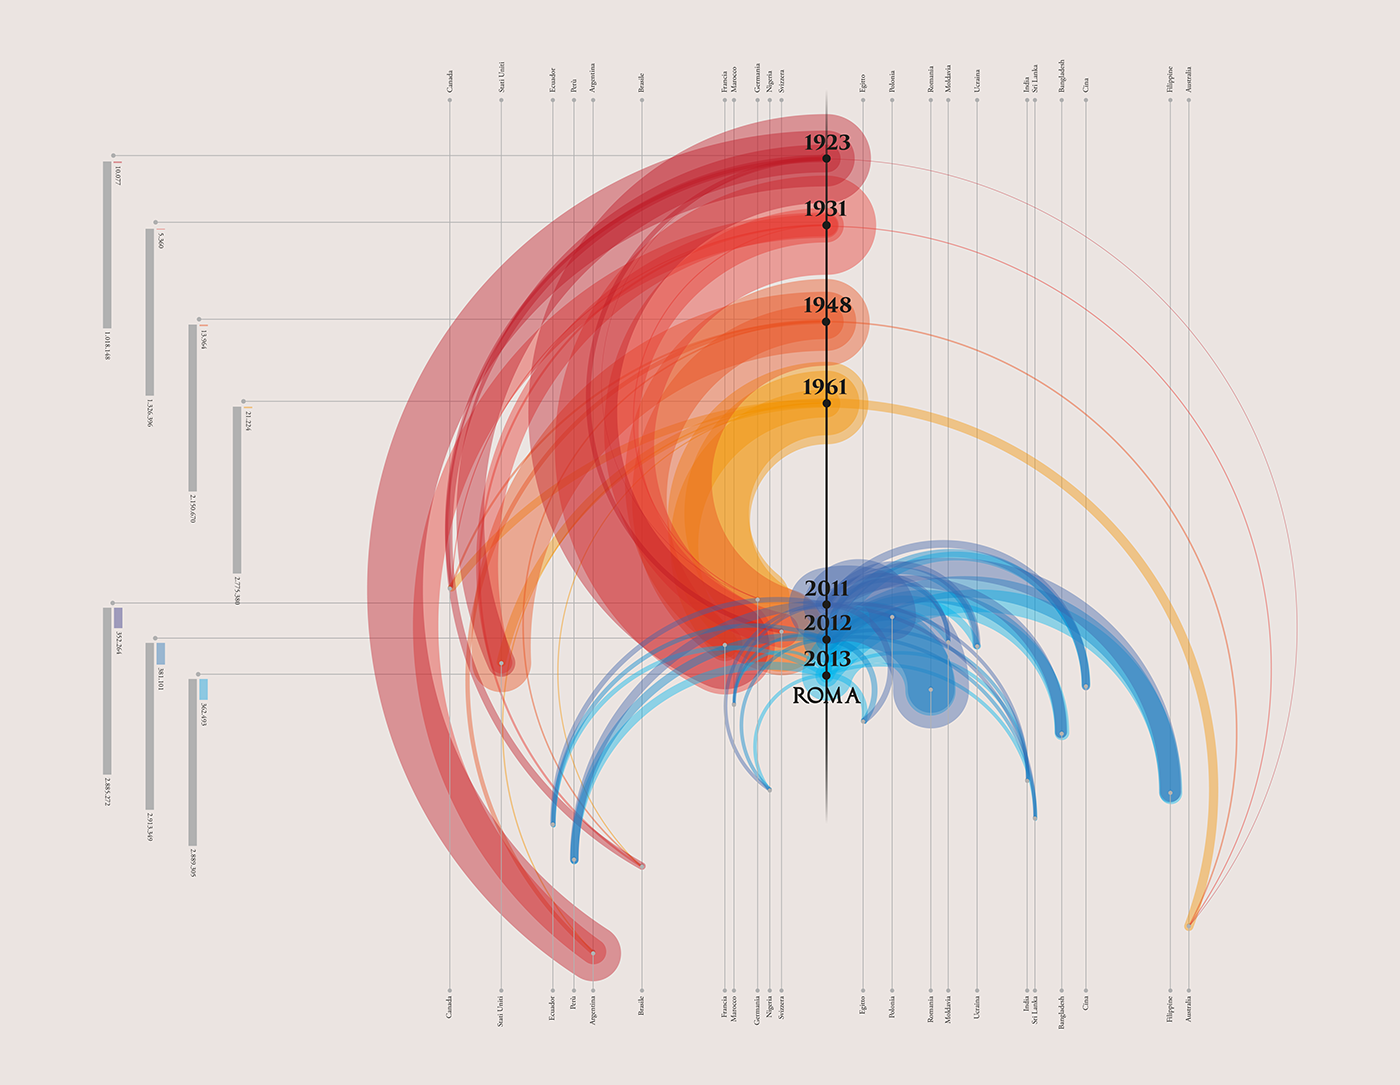
Own project of data visualization explores the phenomenon of Italian emigrations of the 1923, 1931, 1948 and 1961, years when expatriate flows were particularly intense, and compared these data with those of the most recent immigrations of 2011, 2012 and 2013 where Italy becomes the host country, in particular the comparison takes place by analyzing the shifts that have involved the city of Rome.


The Town Hall with the highest number of immigrants is Town Hall I with 49,622 foreigners, followed by VI with 47,339 and third place is the Town Hall V with 36,172 foreigners.
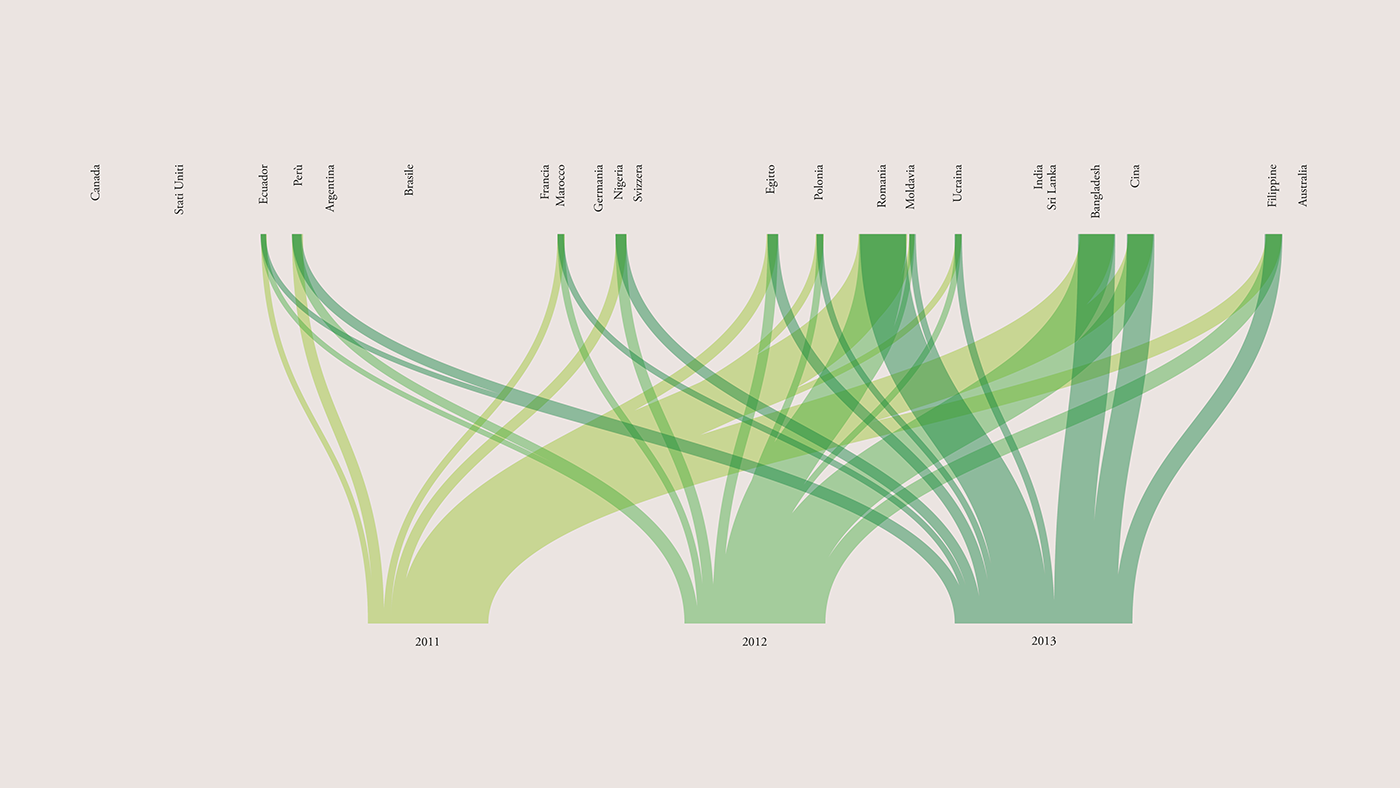
The Focus on Town Hall V, shows the different origins of new residents over the years under consideration throughout the city of Rome.
The Focus on Town Hall V, shows the different origins of new residents over the years under consideration throughout the city of Rome.