Interactive Sound Visualization
This experimental project was created by Pure Data and GEM.
Pure data (aka PD) is an open source visual programming language. Pd enables musicians, visual artists, performers, researchers, and developers to create software graphically, without writing lines of code. Pd is used to precess and generate sound, video, 2D/3D graphics, and interface sensors, input devices, and MIDI. Pd can easily work over local and remote networks to integrate wearable technology, motor systems, lighting rigs, and other equipment. Pd is suitable for learning basic multimedia processing and visual programming methods as well as for realizing complete systems for large-scale projects. (http://puredata.info/)
Gems the Graphics Environment for Multimedia. It was originally written by Mark Danks to generate real-time computer graphics, especially for audio-visual compositions. Because GEM is a visual programming environment, users do not need any experience in traditional computer languages. GEM is a collection of externals which allow the user to create OpenGL graphics within Pd, a program for real-time audio processing by Miller Puckette. There are many different shapes and objects, including polygonal graphics, lighting, texture mapping, image processing, and camera motion. All of this is possible in real-time without any previous programming experience. Because GEM is an add-on library for Pd, users can combine audio and graphics, controlling one medium from another.
(http://puredata.info/downloads/gem/documentation/manual/manual/referencemanual-all-pages)
(http://puredata.info/downloads/gem/documentation/manual/manual/referencemanual-all-pages)
With the help of Digital+media department (instructor : Sungjoo Park and Yi Zhang), I used PD and made a high and low frequency of random melody/sound. The high frequency sound is just below the level of hurting your ears and the low frequency sound is low as to vibrate the floor. GEM is used to visualize the two. It gets the frequency and volume as an input and pixelates it. The visual made by GEM is created as if you are in a cube with various colors.
As an interactive aspect of this work, two FSR sensors are used for both sounds. The sensor is connected through Teensy, to the volume of sounds’ PD patch. If the viewer steps on the sensor, the volume will change and reflects to the visual.
As an interactive aspect of this work, two FSR sensors are used for both sounds. The sensor is connected through Teensy, to the volume of sounds’ PD patch. If the viewer steps on the sensor, the volume will change and reflects to the visual.
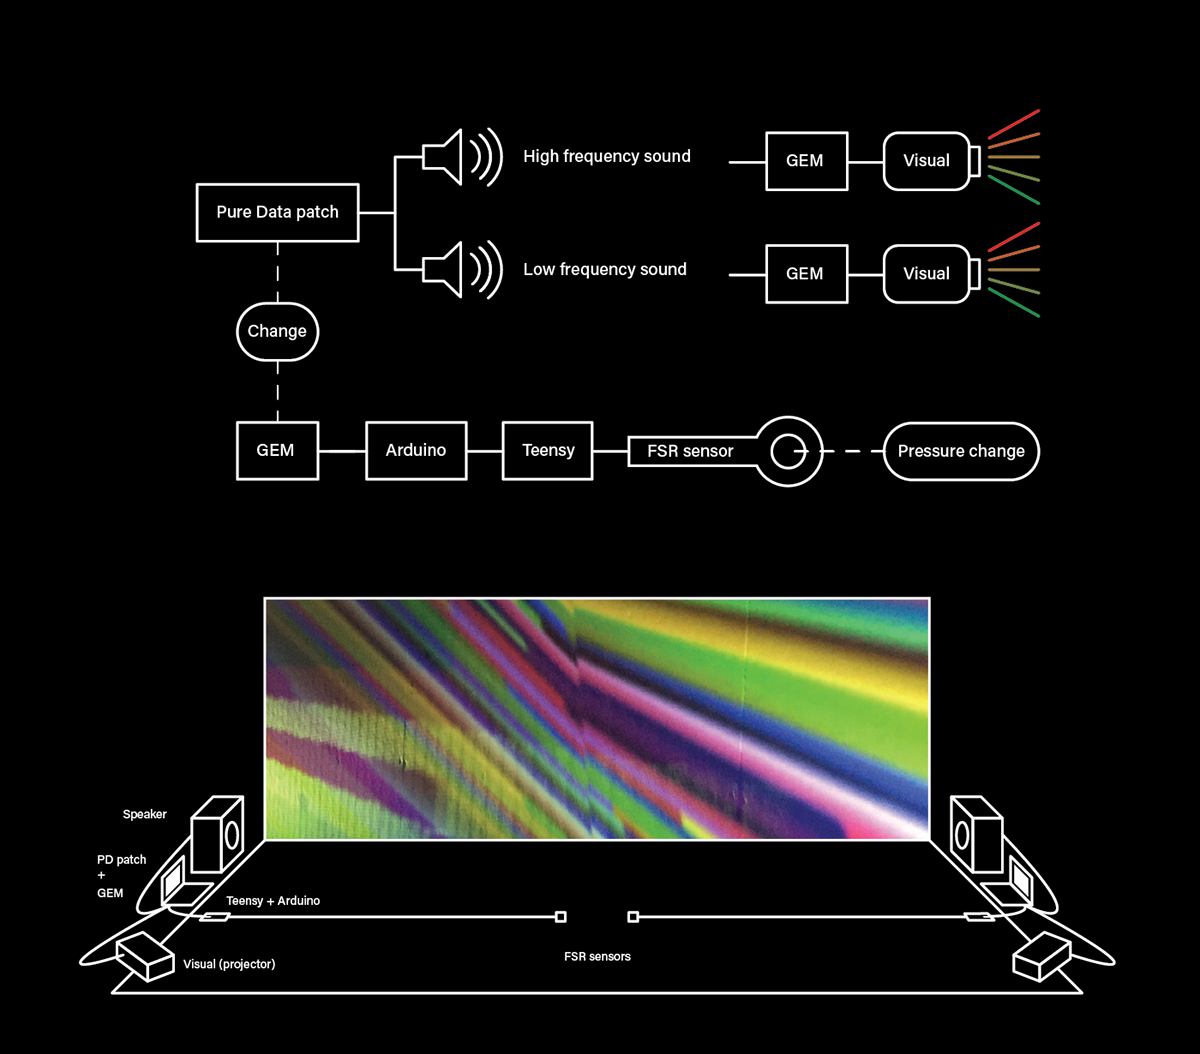
Below 2 videos are the visuals with the sound
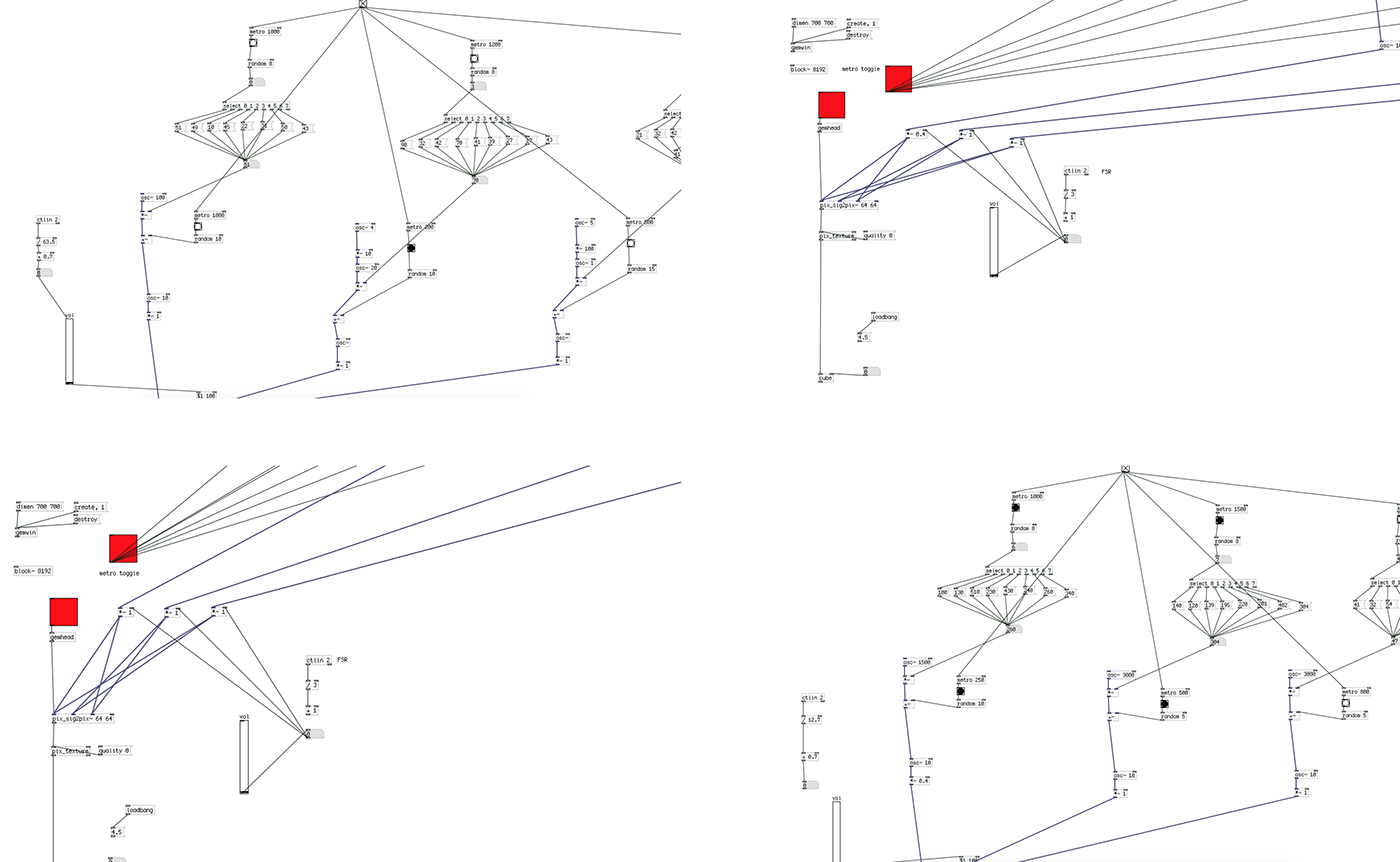
PD patched of the work.
2 sensors to interact with the viewers.


