
Infographic representing the results of Signal Noise's installation "String Theories", which took place at FutureFest 2015, London
The infographic starts with the stats from the event and the String Theories installation.
The overarching results are then shown to give an idea of patterns in the data.
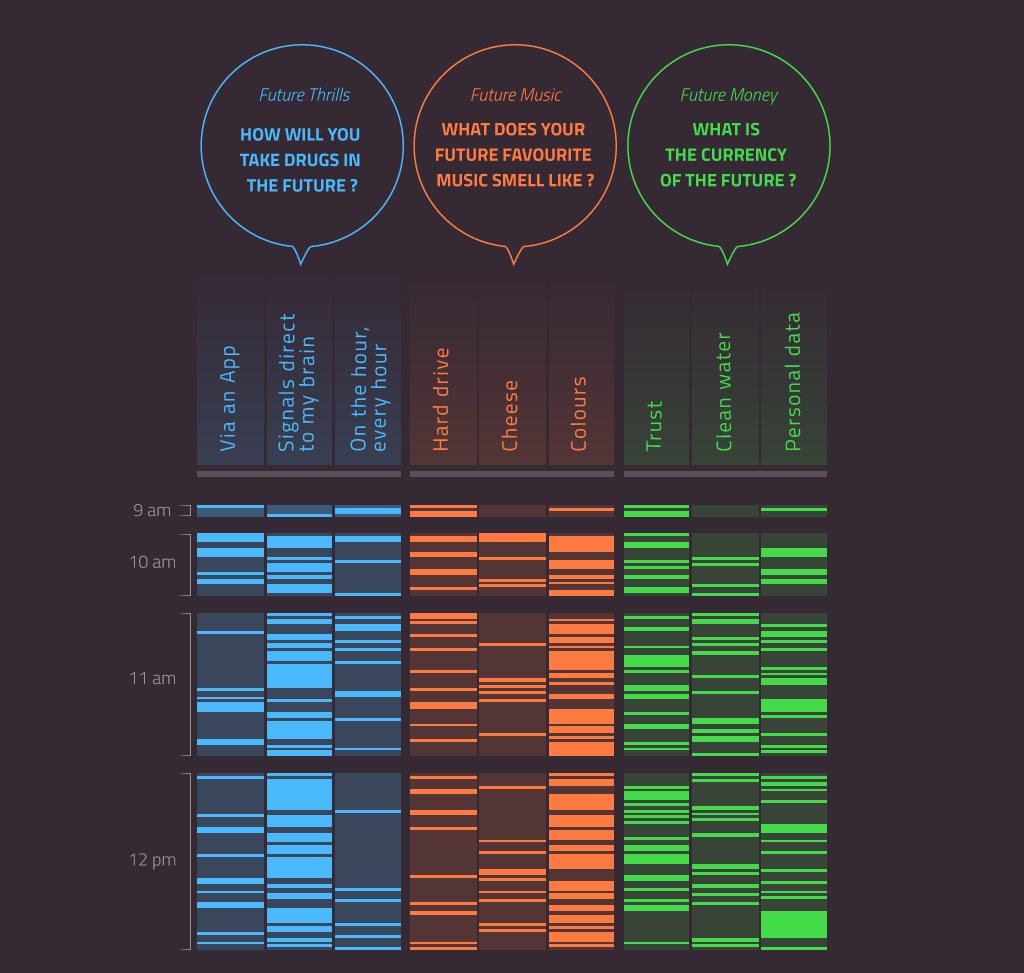
Each question is related to a FutureFest theme, and every theme has a colour. Each answer is represented by a single rectangle. The length of the hour on the vertical depends on the number of users that were active in that hour. The graphic ends with a recap of the topline stats and the most popular answer for each question.

Publication
Zoom

Dataset

Rough


