

🤓
Check the course here
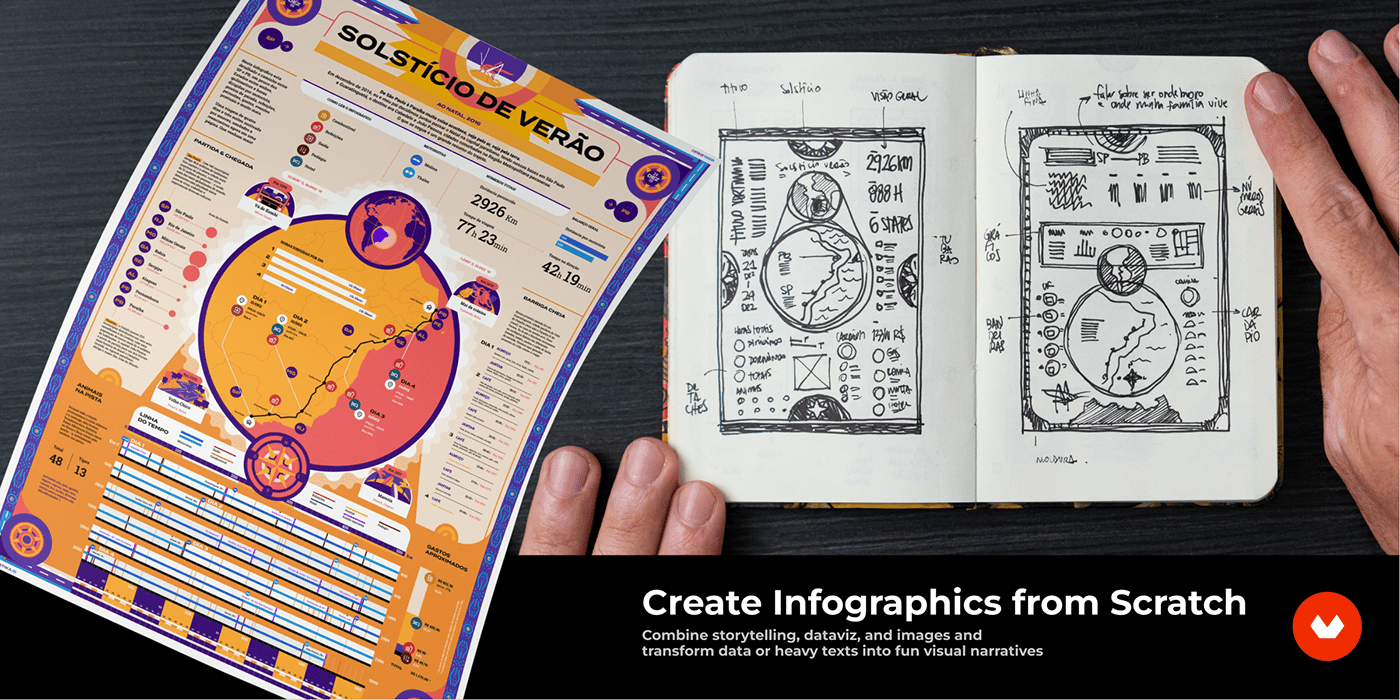
Create Infographics from Scratch
Combine storytelling, dataviz, and images and transform data or heavy texts into fun visual narratives.
Language Portuguese
Subtitles Portuguese, Spanish, English, German, French, Italian, Polish, Dutch
Subtitles Portuguese, Spanish, English, German, French, Italian, Polish, Dutch
––
Intro
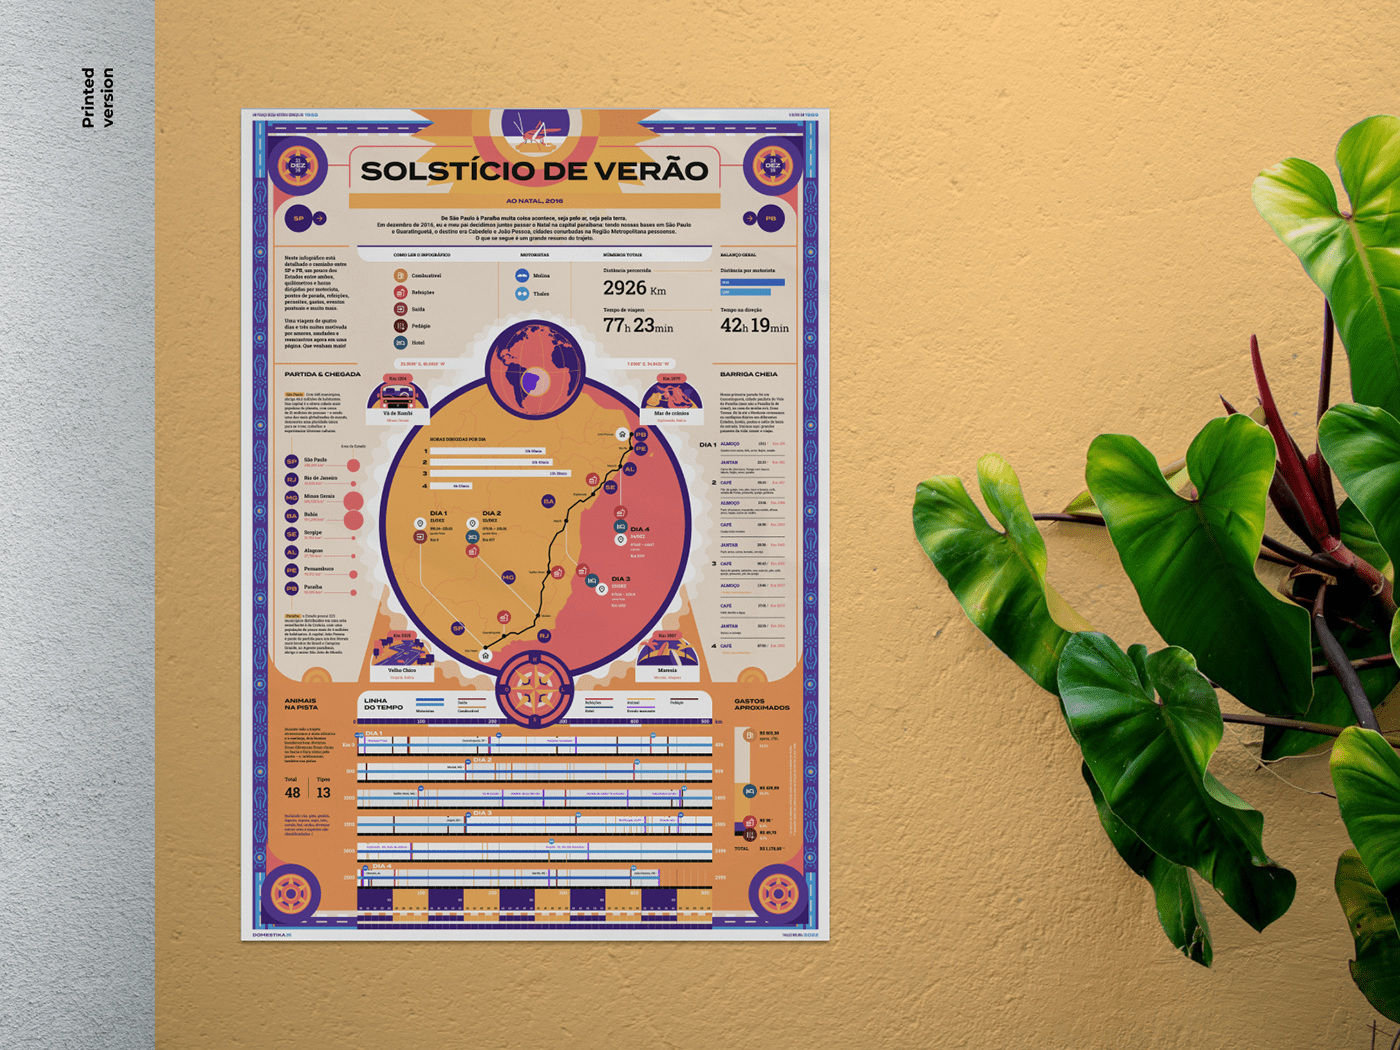
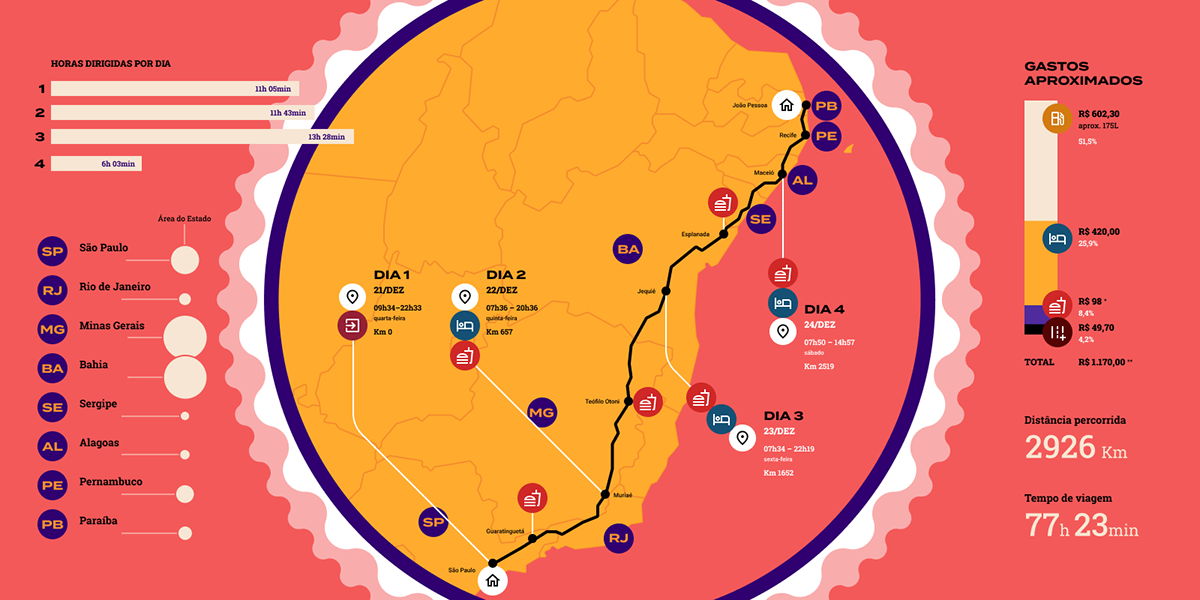
PT / De São Paulo à Paraíba muita coisa acontece, seja pelo ar, seja pela terra.
Em dezembro de 2016, eu e meu pai decidimos juntos passar o Natal na capital paraibana: tendo nossas bases em São Paulo
e Guaratinguetá, o destino era Cabedelo e João Pessoa, cidades conurbadas na Região Metropolitana pessoense. Este projeto é um grande resumo do trajeto.
Cinco anos depois da viagem e deste infográfico a passos lentos, recebi o convite da Domestika para transformar o meu trabalho em uma aula. Abaixo você verá um pouco do processo, estrutura e resultado!
––
EN / A lot happens from São Paulo to Paraíba, two Brazilian States, whether by air or by land.
In December 2016, my father and I decided to spend Christmas together in the capital of Paraíba: having our bases in São Paulo and Guaratinguetá, the destination was Cabedelo and João Pessoa, conurbated cities in the Metropolitan Region of the capital of Paraíba. This project is an excellent summary of the path.
Five years after the trip and this slow-paced infographic, I received an invitation from Domestika to turn my work into a class. Below you will see a little of the process, structure, and result!


Como fazer
/ How to do
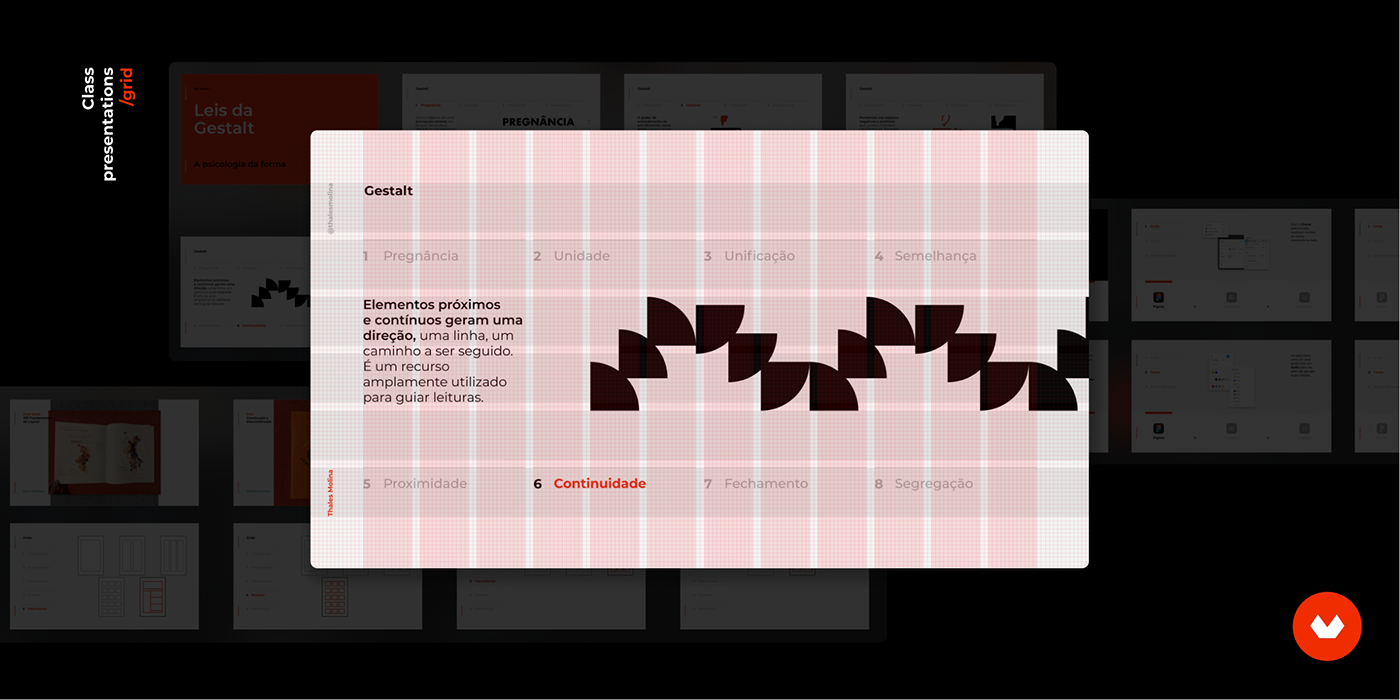
PT / Para desenvolver as aulas, precisei seguir as diretrizes de fonte e cores da Domestika.
A partir de uma estrutura tipográfica, defini cinco estilos de texto e um grid modular para as apresentações de slides. Abaixo, uma pequena parte do conteúdo teórico e inspiracional presentes nas Unidades de ensino.
––
EN / To develop the classes, I followed Domestika's font and color guidelines.
I defined five text styles and a modular grid for the slideshows from a typographic structure. Below is a small part of the theoretical and inspirational content present in the Teaching Units.


Conteúdo
/ Content
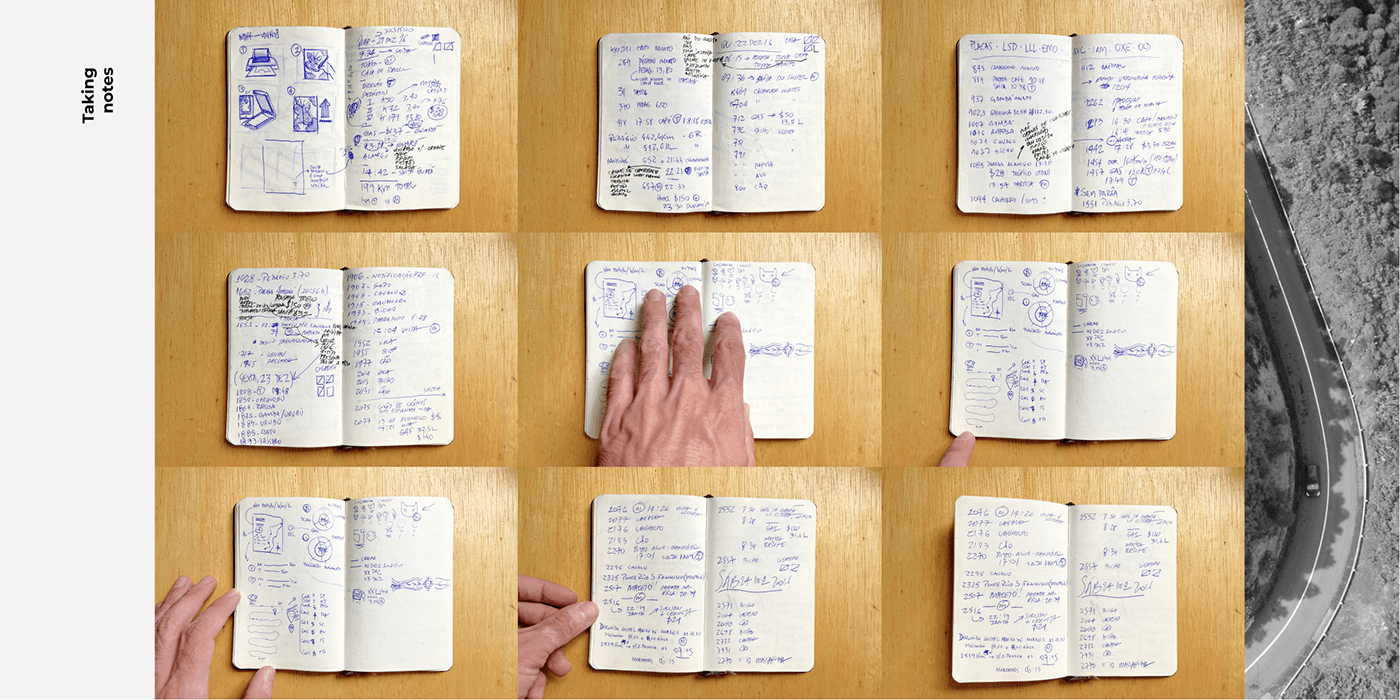
PT / Nas estradas, eu e meu pai tomamos algumas notas.
Até o resultado final de um infográfico existem passos como passar os dados a limpo, gerar gráficos, fazer pesquisas, se inspirar e preparar a estrutura seguindo fundamentos do design.
––
EN / On the roads, my father and I write a lot.
Until the final result of an infographic there are steps such as clearing the data, generating graphics, doing research, getting inspired and preparing the structure following design fundamentals.


Passo-a-passo
/ Step-by-step
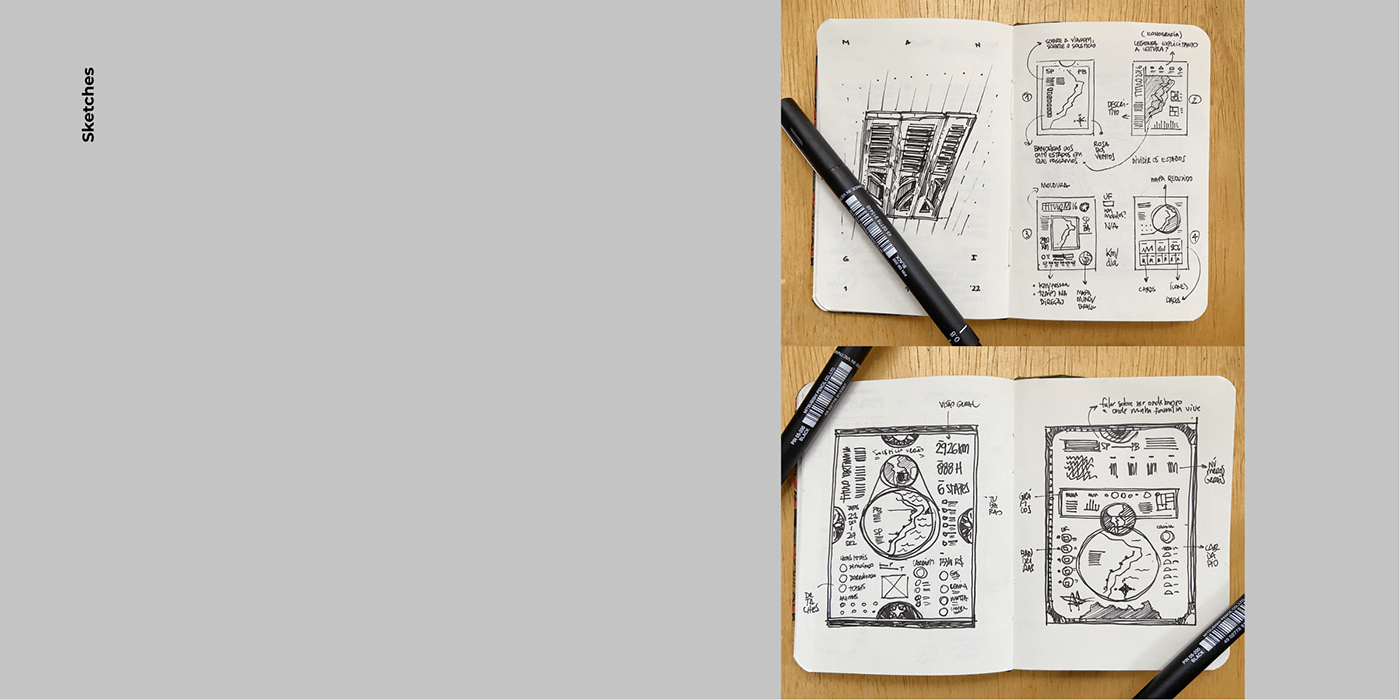
PT / Uma visão rápida de todas as versões e sua evolução.
––
EN / A quick overview of all versions and their evolution.

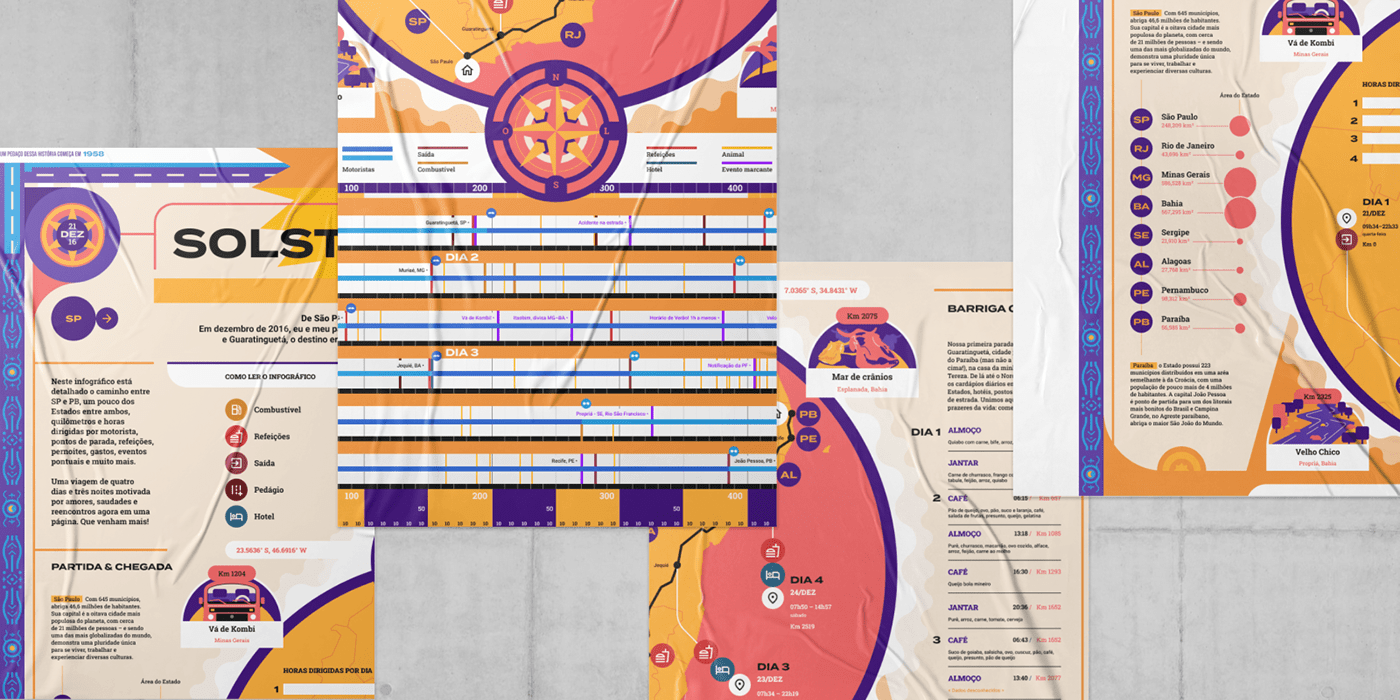
Detalhes
/ Details
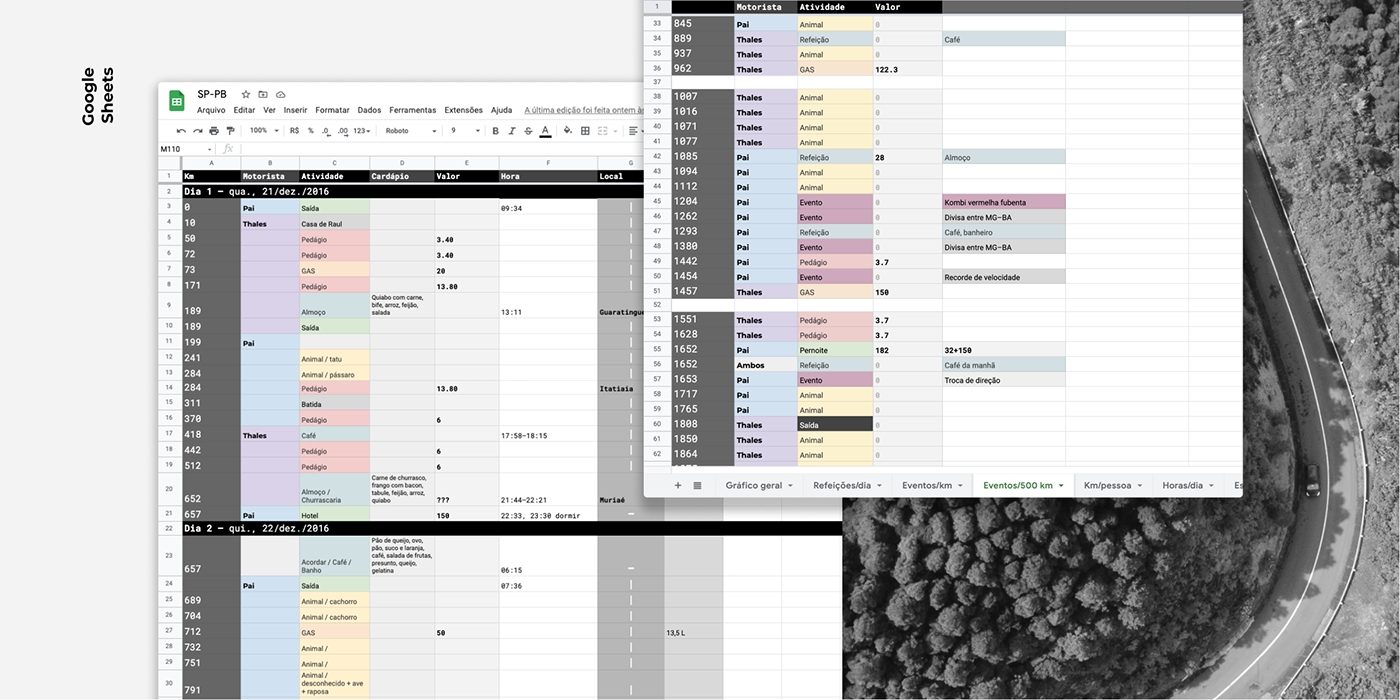
PT / No computador, as anotações viraram imagens!
Até o resultado final de um infográfico existem passos como passar os dados a limpo, gerar gráficos, fazer pesquisas, se inspirar e preparar a estrutura seguindo fundamentos do design. O resultado abaixo mostra estruturas de cor e elementos gráficos para que a história seja contada corretamente.
––
EN / On the computer, notes turned into images!
Until the final result of an infographic there are steps such as clearing the data, generating graphics, doing research, getting inspired and preparing the structure following design fundamentals.The result below shows color structures and graphic elements so that the story is told correctly.
Until the final result of an infographic there are steps such as clearing the data, generating graphics, doing research, getting inspired and preparing the structure following design fundamentals.The result below shows color structures and graphic elements so that the story is told correctly.


E mais...
/ This project is real
PT / Pronto, este pôster carrega histórias, carinho e arte.
Agradeço demais a Domestika pela oportunidade e incentivo da criação do infográfico. Viver a experiência de compartilhar tanto do trabalho, quanto da vida, unindo experiências únicas ao design faz com que a vontade de se contar e criar histórias permaneça.
No curso explico os porquês de cada estrutura visual, a base de criação, elementos gráficos de apoio, desenvolvimento e leitura da infografia e ilustrações. Com os gráficos, números e leituras chegamos a diversas conclusões que trazem uma nova perspectiva de narrativa.
––
EN / Okay, this poster carries stories, affection and art.
I am deeply grateful to Domestika for the opportunity and encouragement to create the infographic. Living the experience of sharing work and life and uniting unique experiences into the design makes the desire to tell and develop stories always remain.
I am deeply grateful to Domestika for the opportunity and encouragement to create the infographic. Living the experience of sharing work and life and uniting unique experiences into the design makes the desire to tell and develop stories always remain.
In the course, I explain the reasons for each visual structure, the basis of creation, supporting graphic elements, and the development and reading of the infographics and illustrations. With the graphs, numbers, and readings we reached several conclusions that bring a new perspective to the narrative.