Visualizing locative and time based data on distorted maps.

Experiments
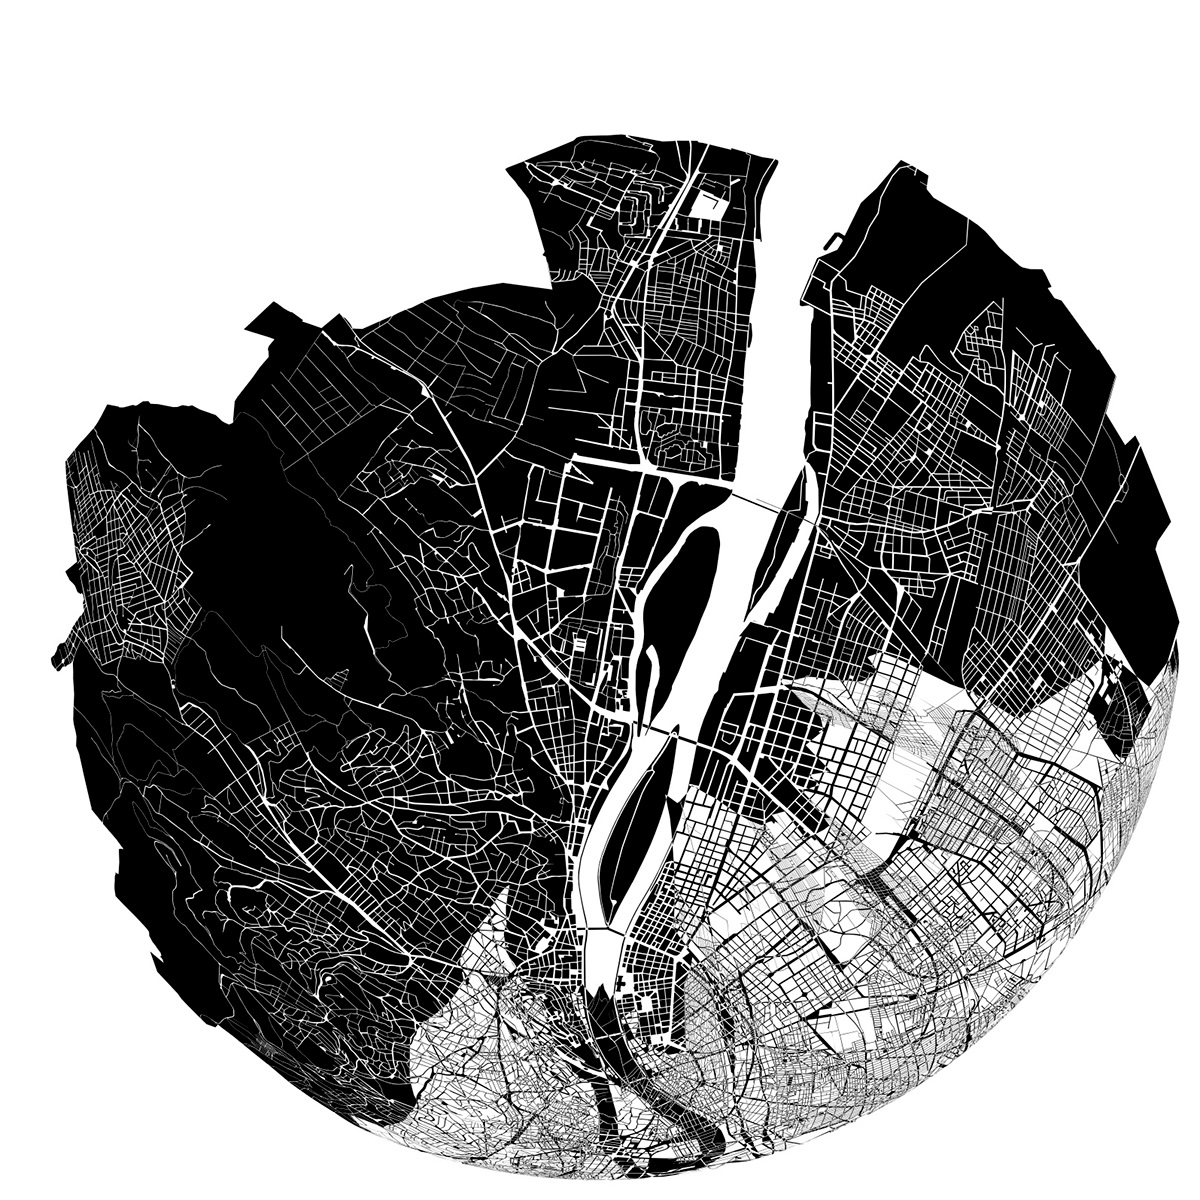
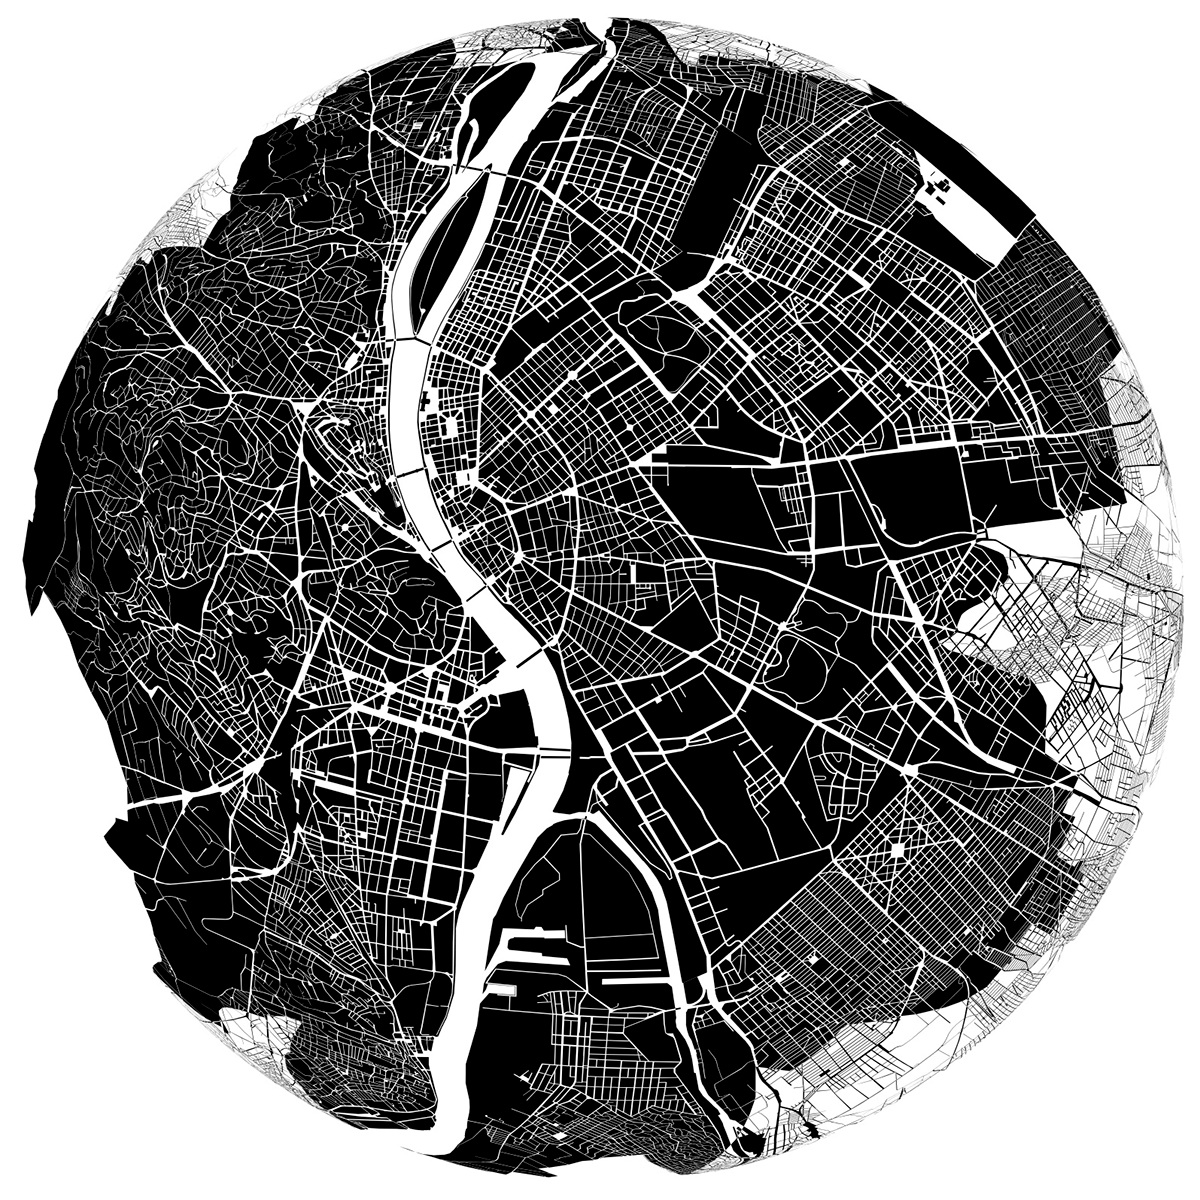
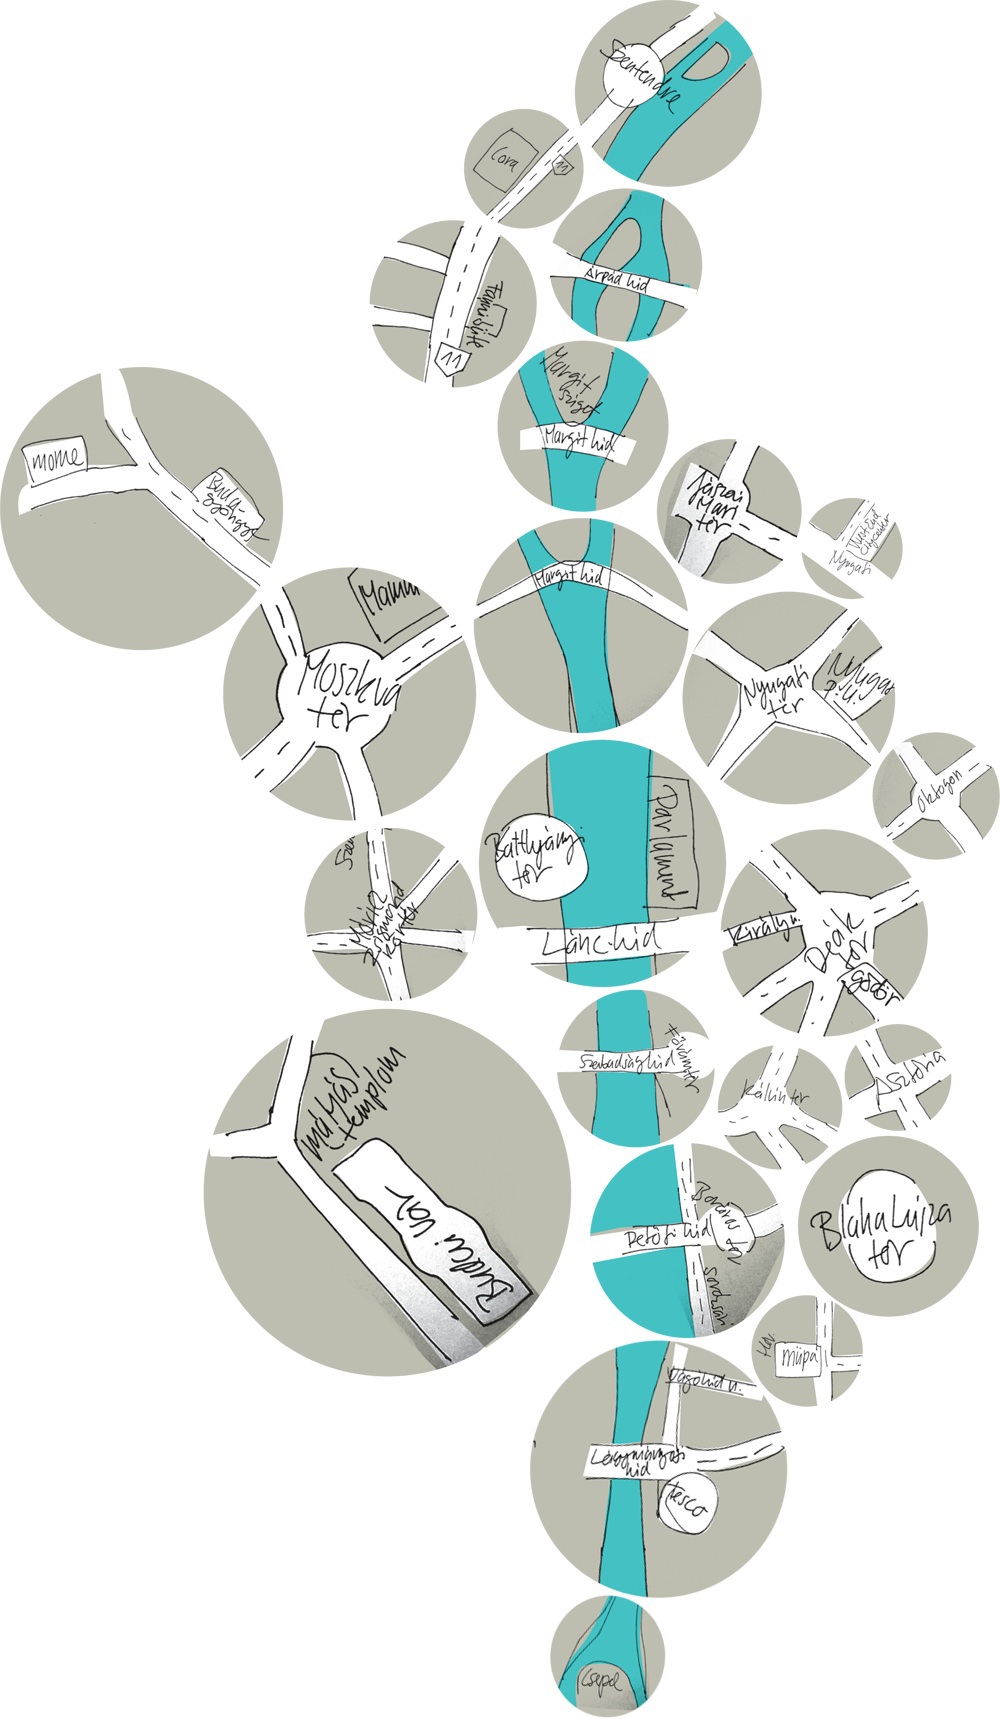
Our first intention was to draw a subjective map of Budapest that represents our preferred places or memories in the city. To achieve this, we considered to use perspective as analogy. The same way things look larger if they are closer to us, we wanted to literally enlarge areas on the map which we feel more connected with. At the same time, locations further away or of less importance loose focus and become smaller.
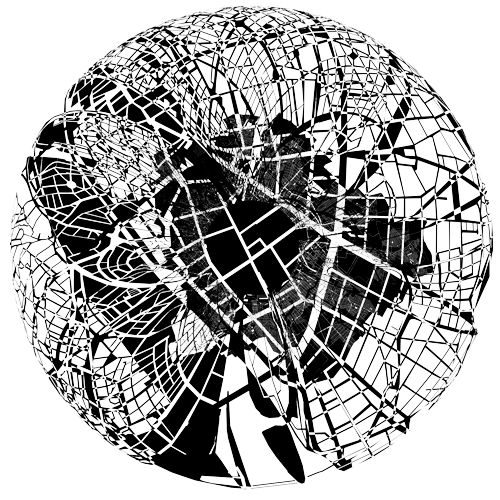
The first attempt was to develop a web-based tool which can distort maps according to one or more locations.
SubMap 2.0: ebullition
Ebullition visualises and sonificates data pulled from one of the biggest news sites of Hungary, origo.hu. The work is part of the project SubMap, which deals with subjective mapping of cities and countries.
One frame is one day, and on one day many things can happen. Depending on how many times a day the name of a city or a village is mentioned on the site, the map of Hungary dynamically distorts according to that number. The sound follows and sonfies that visual outcome, creating a generative ever changing drone.
SubMap x UrbanCyclr (2.1)
Kitchen Budapest and UrbanCyclr teamed up to untangle the invisible pattern of bike traffic in Budapest. 100.000 kilometers of biking routes collected from individual bikers are overlaid on the city map. All distortions of the map reflect higher biking activity in the respective area of the city. 24h map animation reveals the daily biking patterns of a growing community of urban bikers in Budpest.
UrbanCyclr app allows bikers to track their biking routes in the city. The individual routes are added to an aggregated map of the bikers’ community. 100.000 kilometers of biking routes have been collected from individual bikers since the launch of the app in 2011.
SubMap (submap.kibu.hu) is a unique tool to visualize geographic and time-based data on distorted maps. It has a huge potential in coping with data from a physically distributed network of independent sensors.
Featured:
Creative Applications Network, 04/04/2011
brainpickings.org, 06/04/2011
thecreatorsproject.com, 04/04/2011
edgargonzalez.com, 13/04/2011
UrbanTick, 24/06/2011
Visual.ly, 01/2012
FlowingData, 09/03/2012
brainpickings.org, 06/04/2011
thecreatorsproject.com, 04/04/2011
edgargonzalez.com, 13/04/2011
UrbanTick, 24/06/2011
Visual.ly, 01/2012
FlowingData, 09/03/2012
Exhibited:
Design Award exhibition - Museum of Fine Arts, Budapest, 7-16/10/2011
Lodz Design Festival - Lodz, Poland, 20-30/10/2011
Lodz Design Festival - Lodz, Poland, 20-30/10/2011
Subjective Budapest Maps - Galeria Centralis, Budapest, 20/10/2010-02/12/2010
Under the knife, with Cannelle Tanc - Budapest Fiction gallery, 01/07/2010-24/07/2010
Recycle X - Noordkaap, Dordrecht, 07/08/2010
Subjective Budapest Maps - Galeria Centralis, Budapest, 20/10/2010-02/12/2010
Recycle X - Noordkaap, Dordrecht, 07/08/2010
Subjective Budapest Maps - Galeria Centralis, Budapest, 20/10/2010-02/12/2010